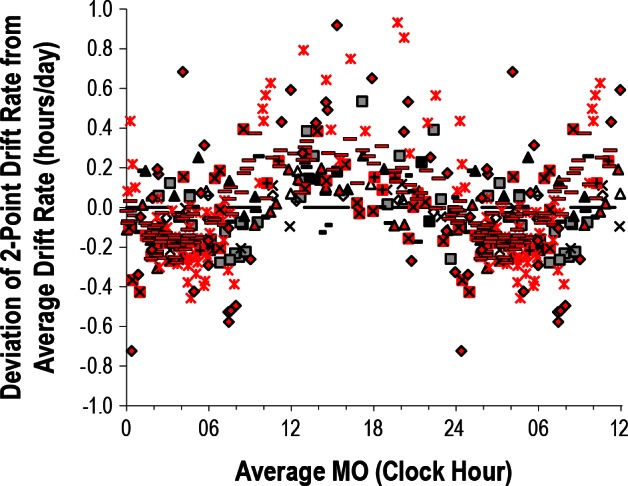
Figure 4.

Plot of drift rate of circadian phase versus clock hour of circadian phase for the 14 subjects who demonstrated statistically significant relative coordination. The deviation of each two-point drift rate from the average drift rate is plotted versus the corresponding average melatonin onset (MOavg) for every subject. The data are plotted 1.5 times.
