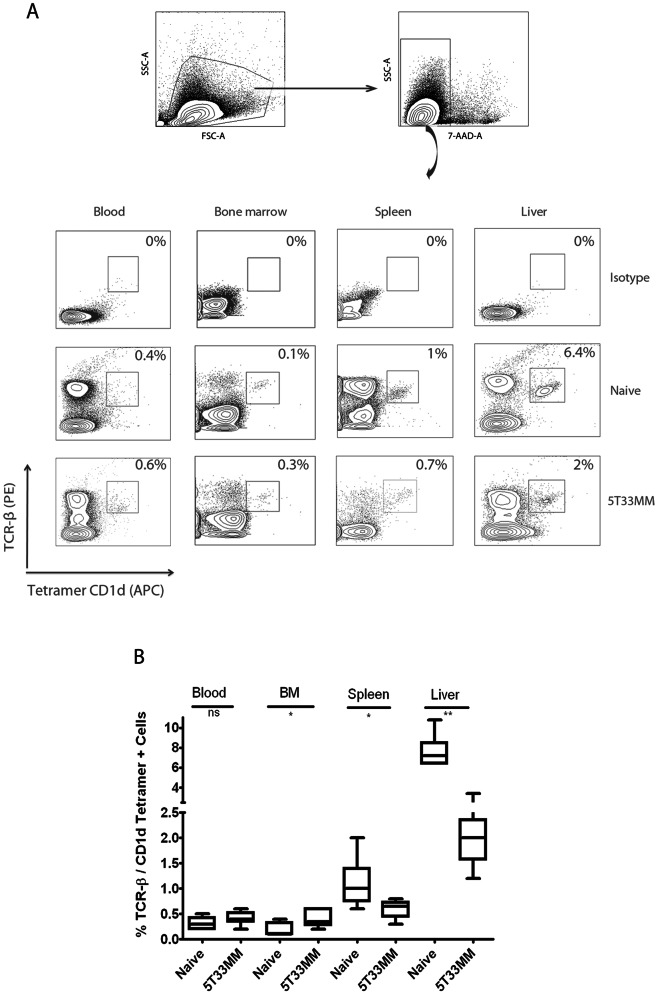
Figure 1. iNKT numbers in the 5T33MM model.
(A) Representative FACS analysis of murine iNKT cells from blood, BM, spleen and liver in naive and 5T33MM mice. Live cells (7-AAD negative) were stained with α-GalCer/CD1d tetramer which specifically binds to Vα14 of the invariant TCR and with TCR-β. Double positive iNKT cells were gated. The percentages are indicated in each plot. (B) Box plots of the distribution of iNKT number data, obtained from 6 mice from independent experiments. Differences between naive and 5T33MM cells in BM, liver and spleen are significant (* and ** indicate p<0.05 and p<0.005, Mann-Whitney test).

