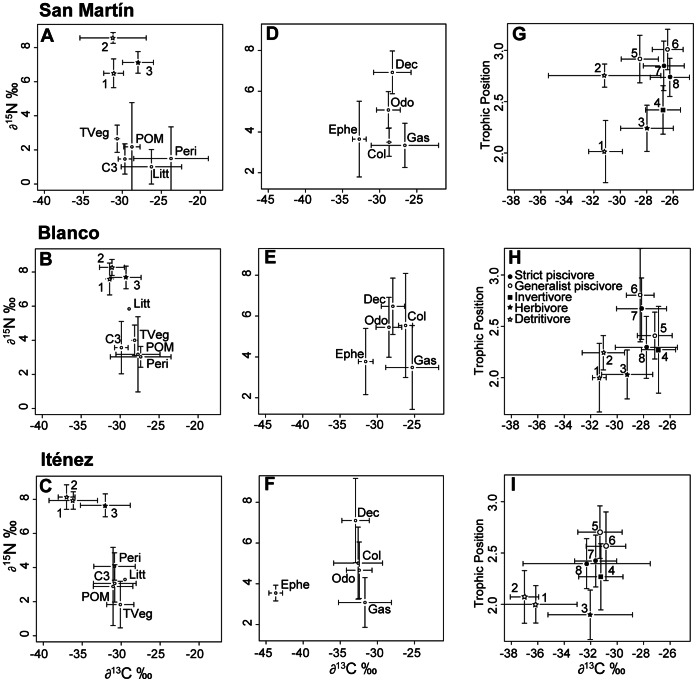
Figure 2. Isotopic signature of sources, invertebrates and fish in three rivers of the Iténez basin (Amazon, Bolivia).
Biplots display mean values (± sd in error bars) of δ13C and δ15N values for sources (A,B,C) POM = Particulate organic matter, Litt = Leaf litter, Peri = Periphyton; C3 = C3 aquatic macrophytes and TVeg = Terrestrial Vegetation; and invertebrates groups (D,E,F): Ephe = Ephemeroptera, Odo = Odonata, Dec = Decapoda, Col = Coleoptera and Gas = Gasteropoda. (G,H,I) represented mean values (± sd in error bars) of δ13C and Trophic Position (derived from δ15N) of fish species: detritivore (1 = Curimatella cf. alburna, 2 = Psectrogaster sp.), herbivore (3 = Schizodon fasciatus), insectivore (4 = Triportheus angulatus) and piscivore (5 = Pseudoplatystoma sp., 6 = Pygocentrus nattereri, 7 = Hoplias malabaricus and 8 = Acestrorhynchus sp.). In biplots (A,B,C), C4 aquatic marcophytes (δ13C : −12.3 to −13.2‰; δ15N : 2 to 2.2‰) were not plotted and δ13C and δ15N values of detritivore (1, 2) and herbivore (3) fish species were reported.

