Figure 4.

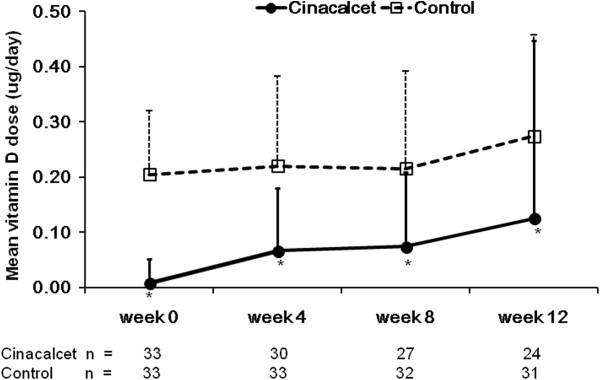
Mean vitamin D dose at each time point. Error bars denote standard deviation (SD). *P < 0.05 as compared with control group.

Mean vitamin D dose at each time point. Error bars denote standard deviation (SD). *P < 0.05 as compared with control group.