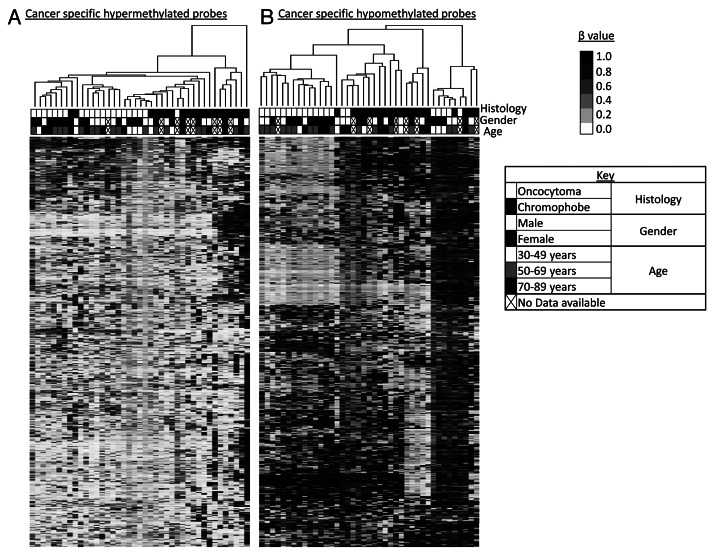
Figure 2. Supervised hierarchical clustering using Euclidean distance complete linkage of the 500 most variable cancer-specific hypermethylated (A) and hypomethylated (B) loci. Below the hierarchical cluster, the top row shows black squares for chromophobe samples and white squares for oncocytoma samples. Gender is denoted in the middle row: female by black squares and male by white squares. Patient age range is indicated in the lower row: 30–49 y, white squares; 50–69 y, gray squares; 70–89 y, black squares. Samples lacking these data are indicated by crossed out boxes. No clustering was observed in relation to gender or age.

An official website of the United States government
Here's how you know
Official websites use .gov
A
.gov website belongs to an official
government organization in the United States.
Secure .gov websites use HTTPS
A lock (
) or https:// means you've safely
connected to the .gov website. Share sensitive
information only on official, secure websites.
