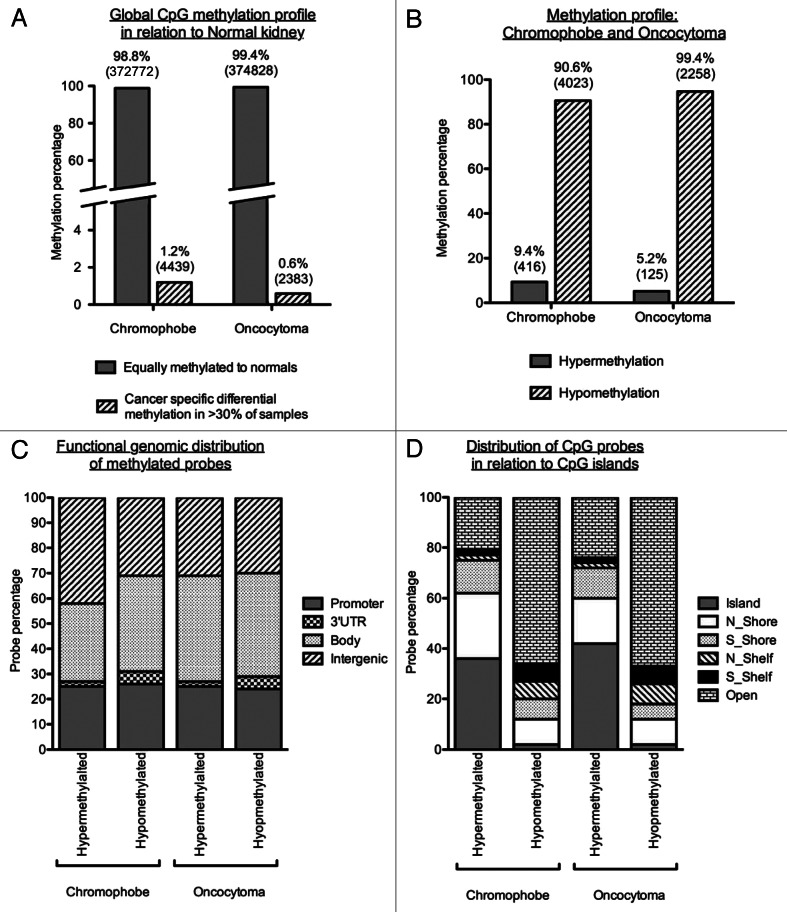
Figure 3. Methylation profiles of chromophobe RCC and renal oncocytoma samples. (A) Global methylation profile was mapped in relation to the 4 normal kidney samples included on the array. Differentially methylated loci were deemed to be all cancer-specific loci showing hyper- or hypo-methylation (1.2% or 4,439 loci for chromophobe samples and 0.6% or 2,383 loci for oncocytoma samples). All other loci not fulfilling this criterion where deemed to be equally methylated to the normal. (B) Methylation profile of cancer-specific loci identified as either hypermethylated (β value > 0.5) or hypomethylated (β value < 0.25) in > 30% of chromophobe RCC and > 30% renal oncocytoma samples. The majority of loci showed hypomethylation in both histologies with less than 10% of cancer-specific probes being hypermethylated. (C) Genomic distribution of cancer-specific hyper- and hypo-methylated CpG loci in relation to their location within known genes. The promoter region indicates loci residing within the 1st exon, 5′UTR, TSS200 and TSS1500 of known genes. CpG distribution did not differ between the two histologies, or between the profiles of hypermethylated and hypomethylated loci. (D) Genomic distribution of cancer-specific hyper- and hypo-methylated CpG loci in relation to CpG density. The majority of hypermethylated loci are shown to reside in areas of high CpG density (CpG islands, north and south shores and north and south shelves): 79.1% for chromophobe samples and 76.0% for oncocytoma samples. Cancer-specific hypomethylated loci are mostly located in isolated/low-density CpG regions known as open sea (65.7% for chromophobe samples and 67.3% for oncocytoma samples).

An official website of the United States government
Here's how you know
Official websites use .gov
A
.gov website belongs to an official
government organization in the United States.
Secure .gov websites use HTTPS
A lock (
) or https:// means you've safely
connected to the .gov website. Share sensitive
information only on official, secure websites.
