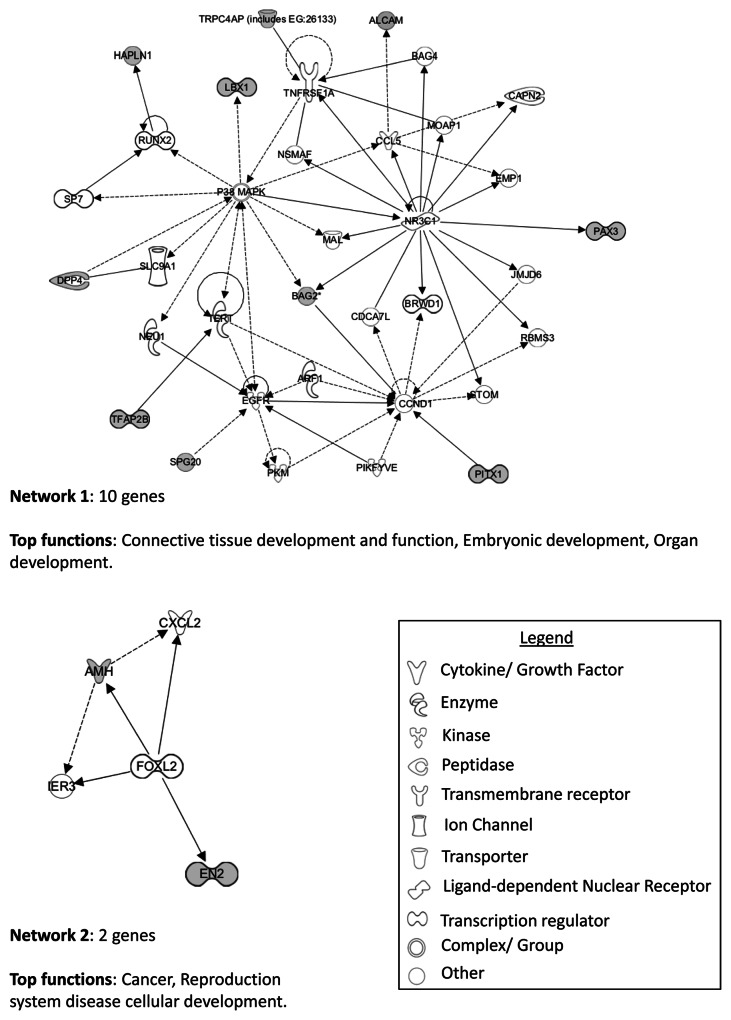
Figure 7. IPA network analysis of genes showing significant differential methylation between chromophobe RCC and renal oncocytoma samples. Top two networks and the interactions between methylated genes (in gray) and connecting genes (in white). Solid arrows represent direct interactions, dashed arrows highlight indirect interactions and solid joining lines identify protein binding.

An official website of the United States government
Here's how you know
Official websites use .gov
A
.gov website belongs to an official
government organization in the United States.
Secure .gov websites use HTTPS
A lock (
) or https:// means you've safely
connected to the .gov website. Share sensitive
information only on official, secure websites.
