
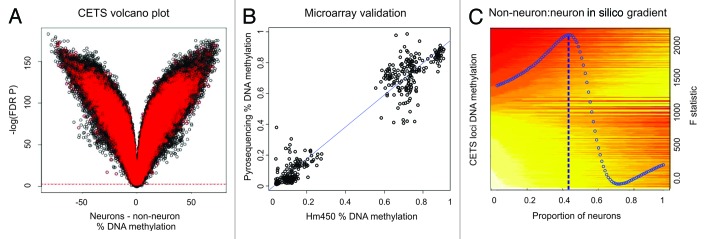
Figure 1. CETS model generation. (A) Volcano plot of DNA methylation vs. –log of FDR significance for neuronal vs. glial DNA methylation profiles. Almost the entire microarray identifies FDR significant changes across cell types. Red spots represent loci significant at a nominal p value of 0.05 in a comparison of MDD vs. control individuals that are excluded from CETS model generation. Green boxes represent top 10,000 CETS markers. (B) Scatterplot of DNA methylation as obtained by HM450 microarrays (x-axis) and by independent pyrosequencing assays (y-axis) at five loci within the top1000 CETS markers. (C) Heat map depicting the in silico virtual gradient of neuronal to glial DNA methylation at the top 10,000 CETS markers generated across our sample of 58 individuals. Yellow and red denote β values of methylated and unmethyated DNA, respectively. Linear modeling F-statistic for each neuronal proportion is overlaid (blue). Blue dashed line depicts the model prediction of 43%.