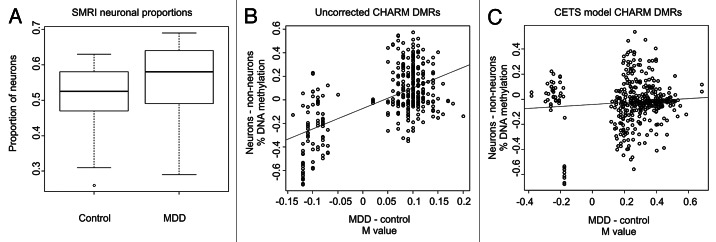
Figure 4. Identification and correction of cell heterogeneity in MDD. (A) Boxplots of the proportion of CETS model predicted neuronal proportions for control and MDD cases. (B) Scatterplot of the log2 fold change (M value) between MDD and controls in non-corrected CHARM data (x-axis) vs. the percentage of DNA methylation difference in FACS separated neuronal and glial nuclei (y-axis) at overlapping loci between the CHARM and HM450 microarray platforms. (C) Scatterplot of the M value between MDD and controls in CETS model corrected CHARM data (x-axis) vs. the percentage of DNA methylation difference in FACS separated neuronal and glial nuclei (y-axis) at overlapping loci between the CHARM and HM450 microarray platforms.
