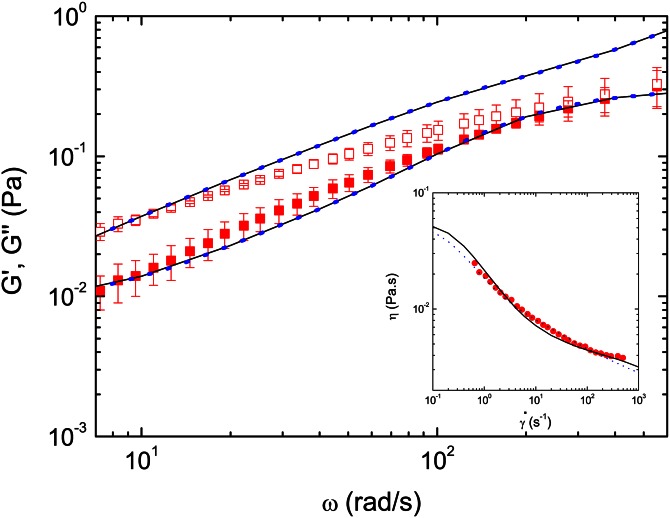
Figure 2.
Storage (red filled squares) and loss (red empty squares) moduli of blood from Figure 1 rescaled to 37 °C using time-temperature superposition, and the fits to multi-mode Giesekus (solid line) and sPTT (blue dots) models. Figure inset shows comparison between the steady shear viscosity curve of whole real blood (red circles) obtained experimentally by Valant et al.30 and the model fits.

