
Figure 4. SPP1 expression in the human motor cortex.
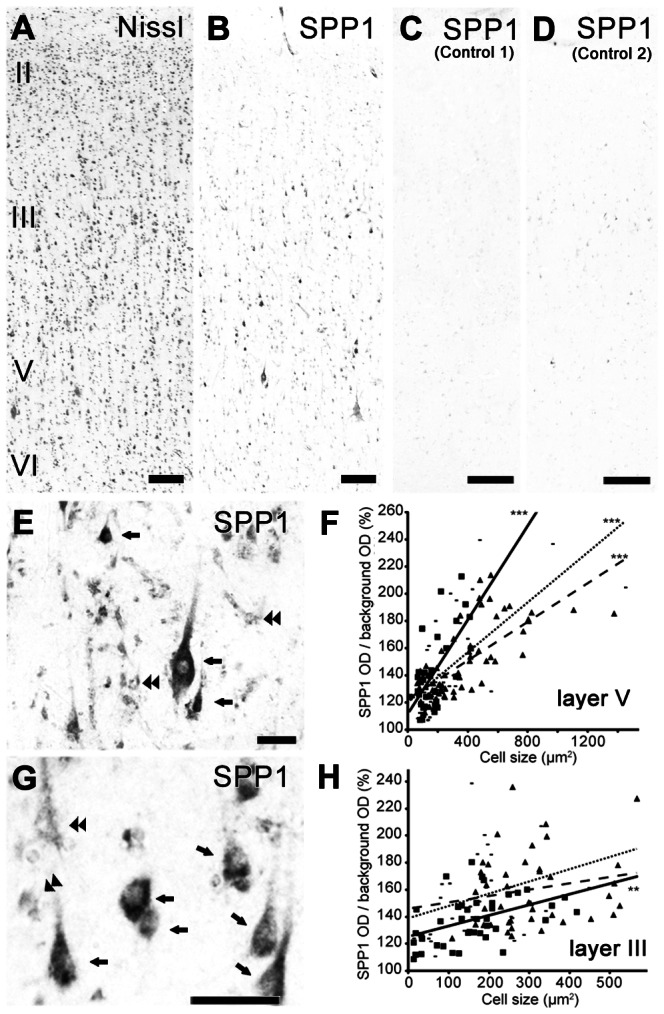
A, B: Nissl-stained (A) and adjacent sections of the human M1 showing the distribution of SPP1protein-positive neurons (B). C, D: Control section incubated without primary antibody for the SPP1 protein (C) and incubated with primary antibody preabsorbed with SPP1 protein (D). E–H: High-magnification photomicrographs of SPP1 protein-positive neurons and scattergram showing the relationship between SPP1 signal intensity and size of the neuronal cell bodies in layers V (E, F) and III (G, H). Arrows and double arrowheads in (E) and (G) indicate neurons showing intense and weak signals, respectively. In (F) and (H), the number of neurons examined was 33, 56, and 42 in layer V, and 41, 41, and 31 in layer III; **P<0.01, ***P<0.0001, according to linear regression analysis. Squares, triangles, and small rectangles in (F) and (H) are data points from each human tissue sample. The solid, dashed, and dotted lines are linear approximations of the data represented by the squares, triangles, and small rectangles, respectively. Scale bars = 200 µm in A–D; 50 µm in E, G