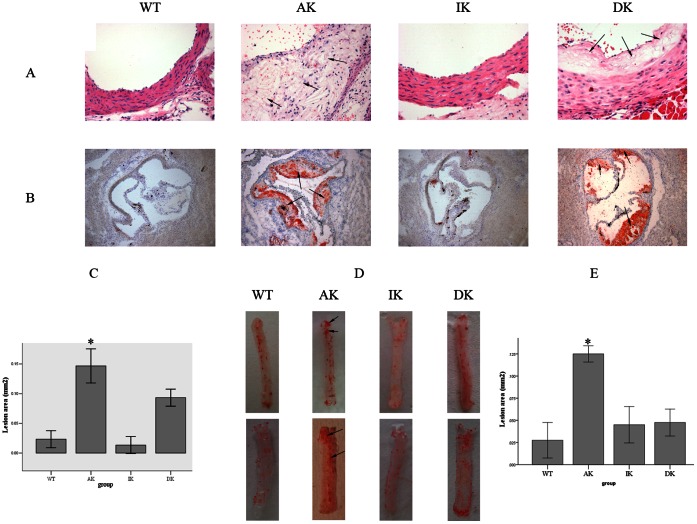
Figure 2. Morphological changes and lipid accumulation of aorta after a HFD feeding.
(A) H&E staining of the aortic vessel wall (8 per group) of the 4 groups of mice. Atherosclerotic lesions, lipid vacuolation and cholesterol crystallization are marked with arrows (400×). (B) Oil Red O stained lipid droplets in frozen aortic vessel wall sections (8 per group) from 4 different groups of mice. Lipid accumulations are marked with arrows (100×). (C) Quantitation of the mean Oil Red O stained plaque areas in the frozen aortic root vessel wall sections (8 per group). Values are means ± SD; n = 8 per group; *P<0.05. (D) Oil Red O staining of the total length of thoracic aorta (8 per group) from 4 different groups of mice after HFD exposure for 12 weeks. Lipid accumulations are marked with arrows. (D) Quantitation of the mean Oil Red O stained plaque area in total length of thoracic aorta area. Values are means ± SD; n = 8 per group; *P<0.05.

