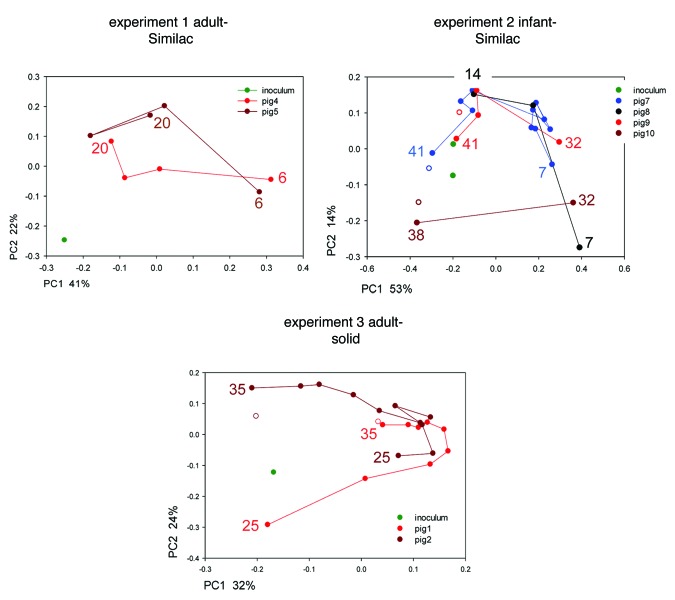
Figure 4. Principal Coordinate Analysis of 16S sequences from human fecal microbiota before and after transplant into germ-free pigs. The analysis is based on pairwise weighted Unifrac distances. Human microbiota are shown in green. Data points from each pig, color-coded as shown in the keys, are connected in chronological order. Numbers indicate age in days of first and last sample. Full symbols indicate microbiota from the feces, empty symbols samples recovered from the colon. The proximity of the gut microbiota and the fecal microbiota obtained on the final day of the experiment (day 41, 38 and 35, respectively) indicate a close similarity between colon and fecal microbiota.

An official website of the United States government
Here's how you know
Official websites use .gov
A
.gov website belongs to an official
government organization in the United States.
Secure .gov websites use HTTPS
A lock (
) or https:// means you've safely
connected to the .gov website. Share sensitive
information only on official, secure websites.
