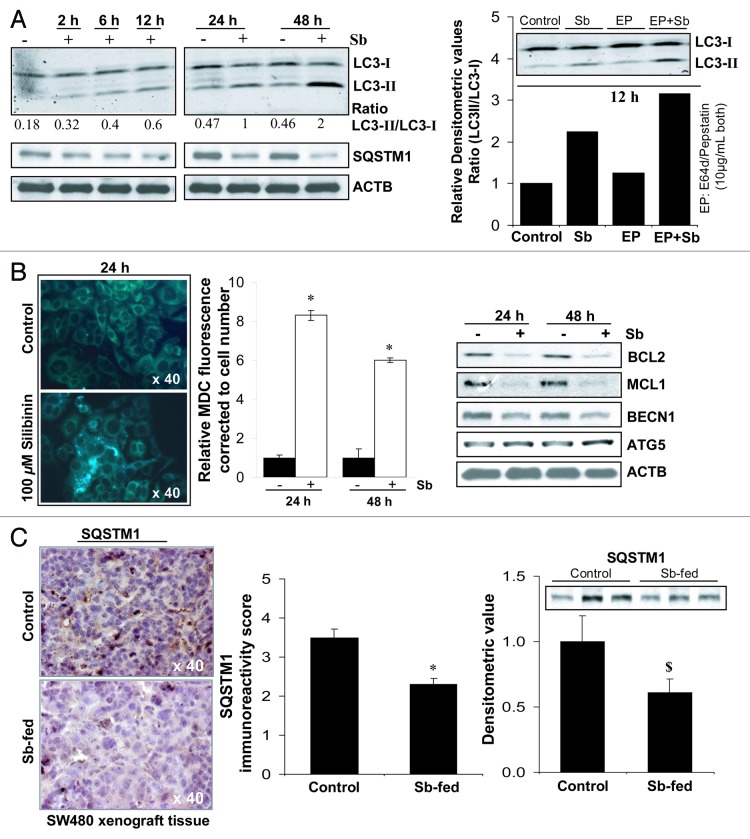
Figure 3. Effect of silibinin on autophagy induction in SW480 cells. (A) Effect of silibinin on the expression levels of LC3-I, LC3-II and SQSTM1 levels, and the turnover of LC3-II after cotreatment with lysosomal inhibitors (E64d and pepstatin A). (B) Effect of silibinin on MDC incorporation and relative MDC fluorescence as detected by fluorescence photometry. (C) Effect of silibinin on SQSTM1 expression in CRC tumor xenografts in nude mice. Archival xenograft tissues of SW480 cells in athymic (nu/nu) nude male mice, as described in Materials and Methods were used in the present study. Representative DAB-stained tissue specimens from control and silibinin-fed groups are shown. Quantification of SQSTM1-positive cells represented as immunoreactivity score is shown as mean and ± SEM (error bars) of each group. Densitometric analysis of band intensity for SQSTM1 protein in immunoblots was adjusted with ACTB (blots not shown), and is shown as mean ± SEM (error bars) of the three bands from individual tumor tissue in each group. All experimental procedures and statistical analysis were performed as detailed in Materials and Methods. $p < 0.05; *p < 0.001.

An official website of the United States government
Here's how you know
Official websites use .gov
A
.gov website belongs to an official
government organization in the United States.
Secure .gov websites use HTTPS
A lock (
) or https:// means you've safely
connected to the .gov website. Share sensitive
information only on official, secure websites.
