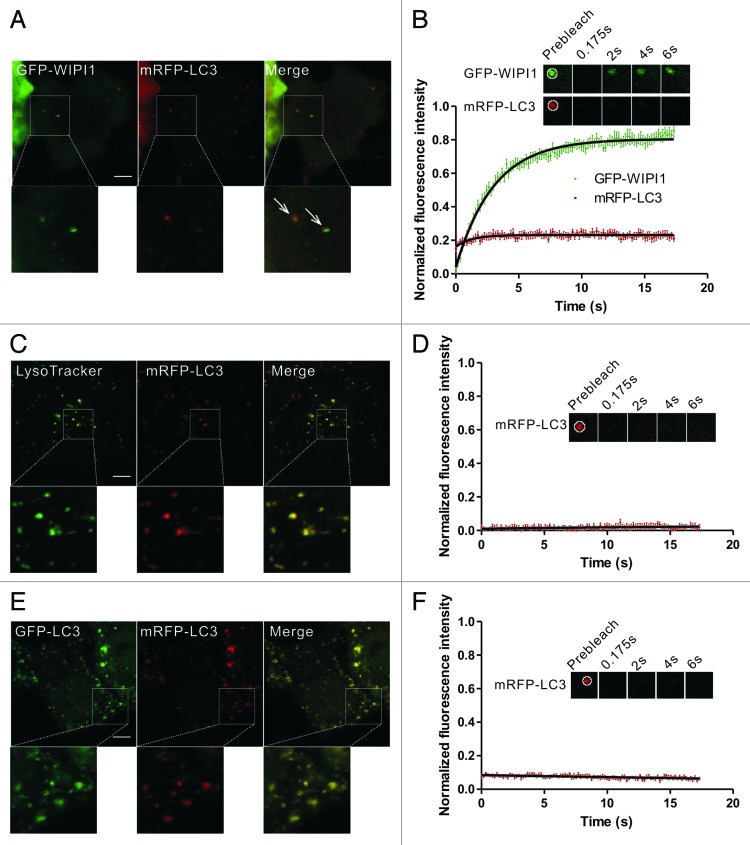
Figure 2. FRAP analysis of the dynamic exchange of LC3 in early autophagic structures and mature autolysosomes. (A and B) HeLa cells coexpressing GFP-WIPI1 and mRFP-LC3 were starved in HBSS for 2 h. The GFP-WIPI1+/mRFP-LC3+ vesicles (arrows) were subjected to two-color FRAP analysis. The recovery kinetics of GFP-WIPI1 and mRFP-LC3 in the autophagosomes are shown in the graph (B). Error bars: the standard error of the mean (s.e.m.) with n = 18. (C and D) HeLa cells expressing mRFP-LC3 were starved for 1.5 h and then stained with 100 nM LysoTracker Green for 30 min. mRFP-LC3 puncta positive for the LysoTracker Green signal were subjected to FRAP analysis. The recovery kinetics of mRFP-LC3 in autolysosomes are shown in graph (D). Error bars: s.e.m. with n = 15. (E and F) HeLa cells were cotransfected with GFP-LC3 and mRFP-LC3 for 24 h and then treated with 50 mM NH4Cl for 1.5 h. The mRFP-LC3 puncta were subjected to FRAP analysis. The recovery kinetics of mRFP signal in autolysosomes are shown in graph (F). Error bars: s.e.m. with n = 8. The inset images in (B–F) are the representative FRAP images. For all FRAP analysis, the puncta were outlined (white circle) and the intensities were extracted. Scale bars: 5 μm. Photobleaching box size: 2.691 μm × 2.691 μm.

An official website of the United States government
Here's how you know
Official websites use .gov
A
.gov website belongs to an official
government organization in the United States.
Secure .gov websites use HTTPS
A lock (
) or https:// means you've safely
connected to the .gov website. Share sensitive
information only on official, secure websites.
