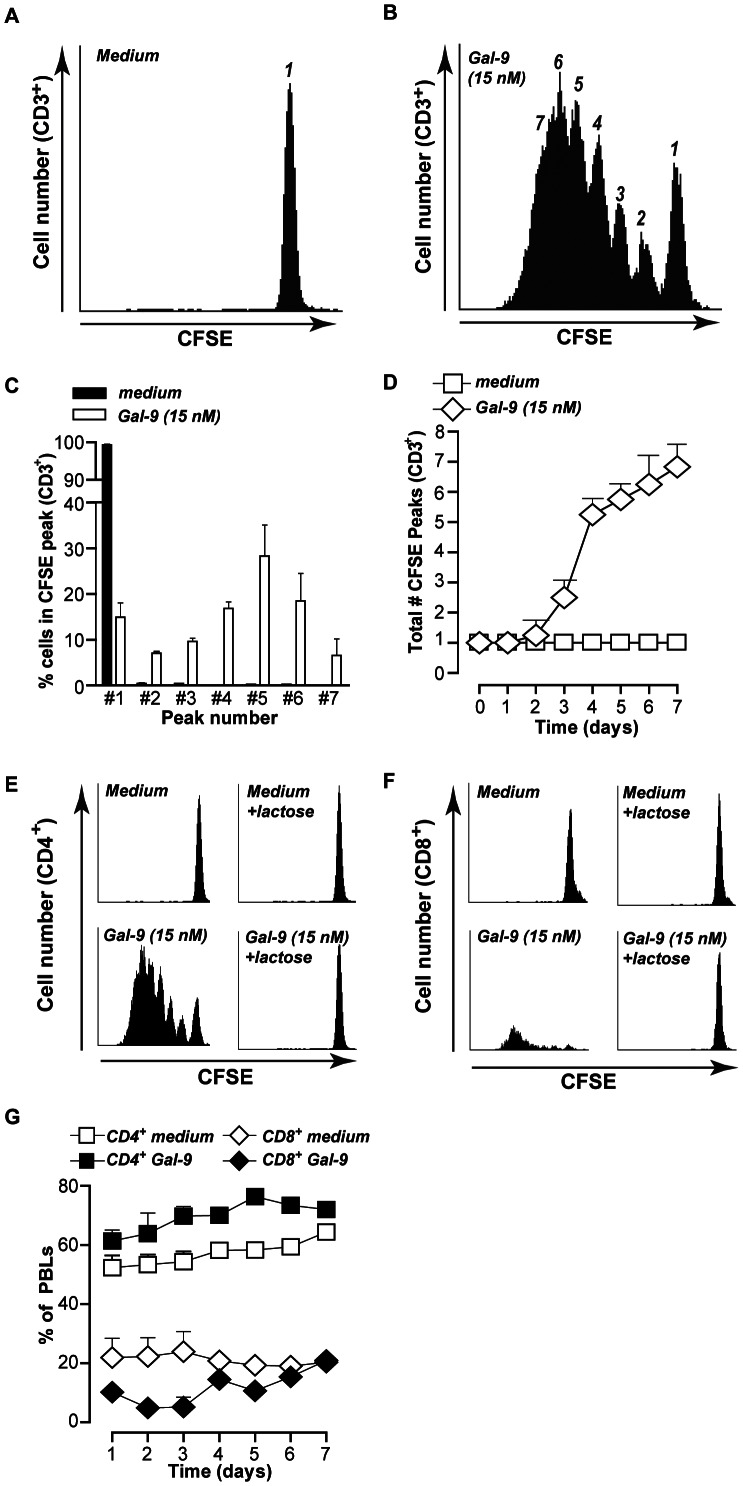
Figure 3. Galectin-9 treatment expands CD4+ T-cells.
A. Representative plot of 6 independent experiments of resting PBMCs stained with CFSE and subsequently incubated in medium for up to 7 days. At Day 7, PBMCs were harvested, stained with the T-cell marker CD3, and CFSE peak pattern was analyzed within the CD3+ cells by flow cytometry. B. Representative plot of 6 independent experiments of resting PBMCs as treated in A, but in the presence of 15 nM Gal-9. C. Analysis of (A) and (B) showing percentage of CD3+ T-cells in the respective peak of all independent experiments (mean +/− SEM). D. Analysis of (B) showing the number of CFSE peaks of all independent experiments. E. Representative plots of 3 independent experiments of resting PBMCs stained with CFSE and subsequently incubated in medium or 15 nM Gal-9 (+/− lactose) for up to 7 days. At Day 7, PBMCs were harvested, stained with the T-cell marker CD4, and CFSE peak pattern was analyzed within the CD-3+ cells by flow cytometry. F. As in (E) but stained for the T-cell maker CD8. G. Resting PBMCs (n = 4) were treated for up to 7 days with medium or Gal-9 and analyzed for CD4 and CD8 distribution. All graphs represent mean +/− SD unless stated otherwise.

