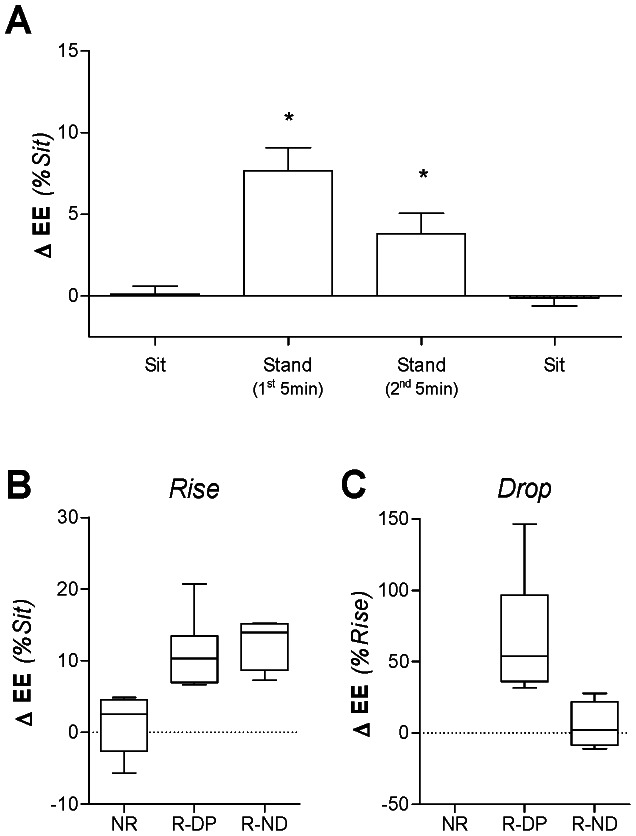
Figure 2. Energy expenditure (EE) during sitting and steady-state (SS) standing.
Mean ± SEM energy expenditure (EE) during sitting and steady-state (SS) standing, expressed as percentage change relative to mean sitting EE (Panel A); *statistically significant from baseline as assessed by repeated-measures ANOVA followed by Dunnett’s multiple comparison tests. In the present study the percentage change from the mean sitting value to the mean of the first 5 min of the SS-standing period is referred to as “rise” from sitting value. The percentage change from the mean of the first 5 min to the mean of the second 5 min of the SS-standing period is referred to as “drop” to sitting value. Box and whisker plot comparing rise (Panel B) and drop (Panel C) for each EE response group. NR = Non-Responders, R-DP = Responder Droppers, R-ND = Responder Non-Droppers.

