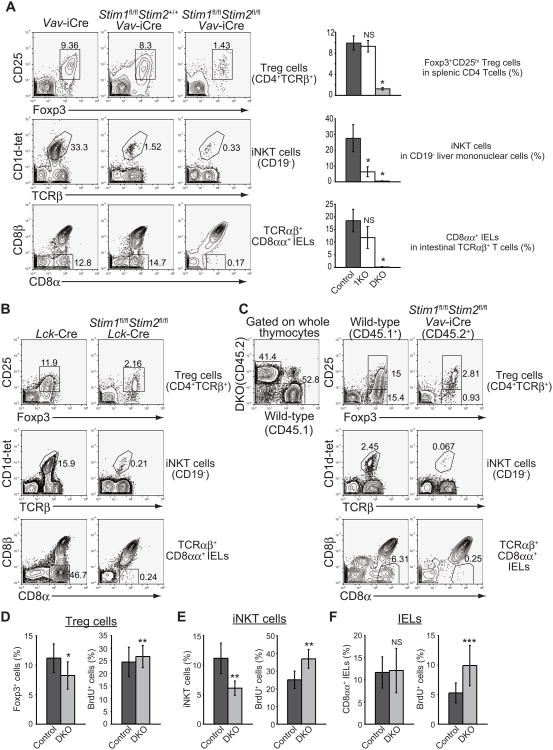
Figure 2. STIM-deficient mice show a significant decrease of regulatory T cells, iNKT cells and TCRαβ+ CD8αα+ IELs in the periphery.
(A) Flow cytometric analysis of Foxp3+ regulatory T cells (top), CD1d-tetramer+ iNKT cells (middle) and TCRαβ+ CD8αα+ IELs (bottom) in Stim1+/+Stim2+/+ Vaν-iCre (left), Stim1fl/flStim2+/+ Vaν-iCre (center) and Stim1fl/flStim2fl/fl Vaν-iCre (right) mice. Right, average frequencies of each population. Control (dark grey bar); 1KO (open bar); DKO (light grey bar). n=4 or 5. *, P<0.01. (B) Flow cytometric analysis of spleen, liver mononuclear cells and intraepithelial cells as in (A). Stim1+/+Stim2+/+ Lck-Cre (left), Stim1fl/flStim2fl/fl Lck-Cre (right). (C) Flow cytometric analysis of Foxp3+ regulatory T cells (top), CD1d-tetramer+ iNKT cells (middle) and TCRαβ+ CD8αα+ IELs (bottom) in competitive mixed bone marrow chimeras. (D to F) Frequencies of Foxp3+ regulatory T cells in splenic CD4+TCRβ+ cells (D), CD1d-tetramer+ iNKT cells in CD19- liver mononuclear cells (E) and CD8αα+ IELs in intestinal TCRαβ+ T cells (F) (left) from the BrdU-treated, poly IC-injected mice, and the frequencies of BrdU-retaining cells in Foxp3+ cells, iNKT cells and TCRαβ+ CD8αα+ IELs (right). n=4-6. *, P<0.005; **, P<0 05; ***, P=0.067; NS, not significant. Data are representative of two (C to H) and more than three (A and B) independent experiments. Error bars (A, D, E and F) denote mean ± SEM. See also Figure S2.

