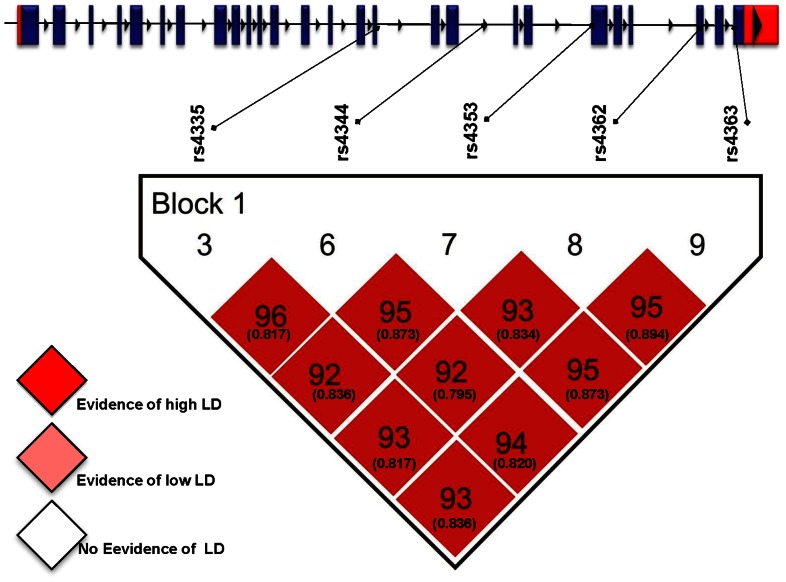
Figure 1. Haploview linkage disequilibrium graph of five ACE gene polymorphisms (rs4335, rs4344, rs4353, rs4362, rs4363).
Pairwise linkage disequilibrium coefficients D ´× 100 are shown in each cell (D ´ values of 1.0 are not shown). Standard color scheme of Haploview was applied for linkage disequilibrium color display (logarithm of odds [LOD] score ≥2 and D ´ = 1, shown in bright red; LOD score ≥2 and D ´<1 shown in shades of pink/red; LOD score ≤2 and D ´<1 shown in white). D values of 1.0 are not shown. Numbers in boxes and parentheses represent D values and r2 values after the decimal point, respectively.

