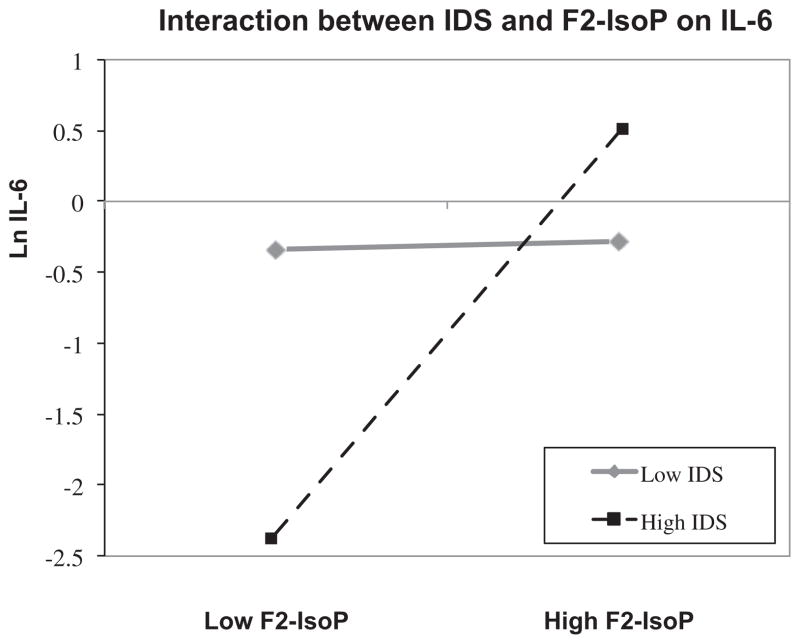
Fig. 2.
Two-way interaction plot illustrating the differential relationship between F2-IsoPs and IL-6, as a function of high versus low depression scores on the IDS. High and low are defined as 1 SD above or below the mean value for both F2-IsoPs and the IDS, based on the approach described by Hayes and Matthes (2009) and the corresponding modprobe macro in SPSS. In subjects with low depression scores, F2- IsoP and IL-6 concentrations are not significantly related. But in subjects with high depression ratings, progressively higher F2-IsoP concentrations are associated with higher IL-6 concentrations.

