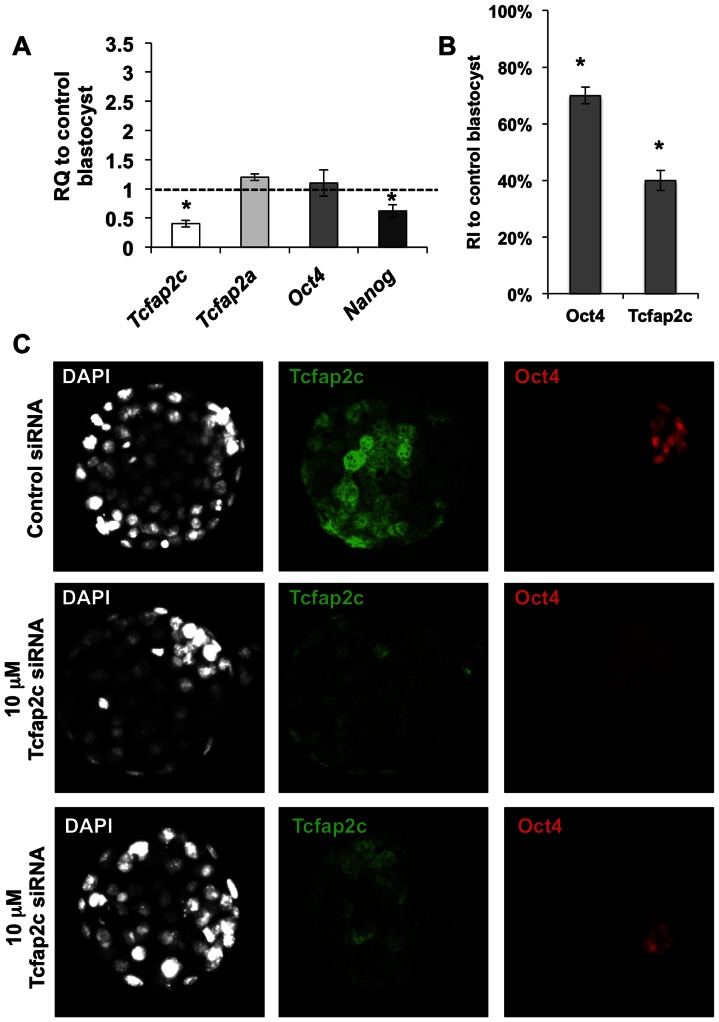
Figure 2. Tcfap2c is not required for restriction of Oct4 expression in the blastocyst ICM.
(A) Validation of siRNA-mediated KD of Tcfap2c transcripts and relative quantification of Tcfap2a, Oct4, and Nanog transcripts in blastocysts by qRT-PCR; RQ (Relative Quantification). Three to four biological replicates with at least 10 embryos per replicate were used. (B) Average levels of pixel intensities of Oct4 and Tcfap2c fluorescent signals in Tcfap2c KD blastocysts were determined with the ImageJ software and compared to those of control (RI; relative intensities). Three biological replicates with at least five embryos per replicate were used to measure the intensities of Oct4 and Tcfap2c in nuclei of control and Tcfap2c KD blastocysts. (C) Two representative images of Oct4 expression in Tcfap2c KD blastocysts. Error bars represent mean ± s.e.m. Asterisk symbol indicates P<0.05(*) compared with the control group.

