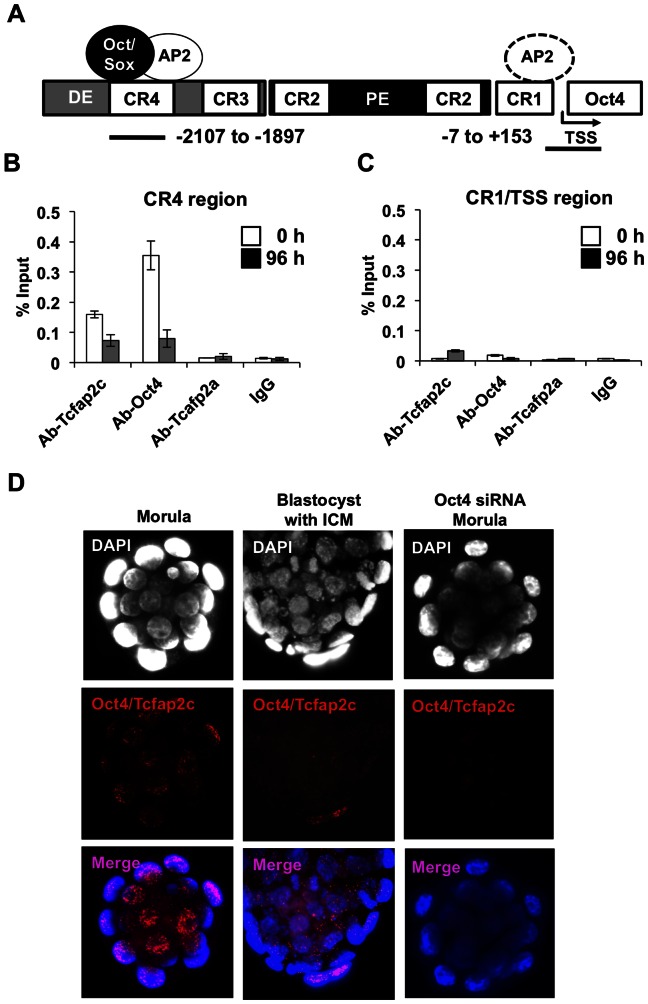
Figure 4. Tcfap2c and Oct4 interactions at the CR4 region of Oct4 during early development.
(A) Schematic diagram of the Oct4 genomic region; DE (Distal Enhancer), PE (Proximal Enhancer), CR (Conserved Region), TSS (Transcription start site), Oct/Sox(Oct4/Sox2 binding site), AP2(Tcfap2 binding site); black line and numbers (amplified regions for ChIP-qPCR and sequences from TSS). (B) ChIP analysis of Tcfap2c, Oct4, Tcfap2a binding to CR4 in uninduced ES cells (0 h) and Cdx2 induced TS-like cells (96 h). (C) ChIP analysis of Tcfap2c, Oct4, Tcfap2a binding to CR1/TSS region. (D) A proximity ligation assay (Duolink) in morulae and blastocysts. A subset of embryos were injected with Oct4 siRNA to deplete Oct4. Red dotted fluorescence indicates sites of interaction of Oct4 and Tcfap2c. Two to three biological replicates were used. Error bars represent mean ± s.e.m.

