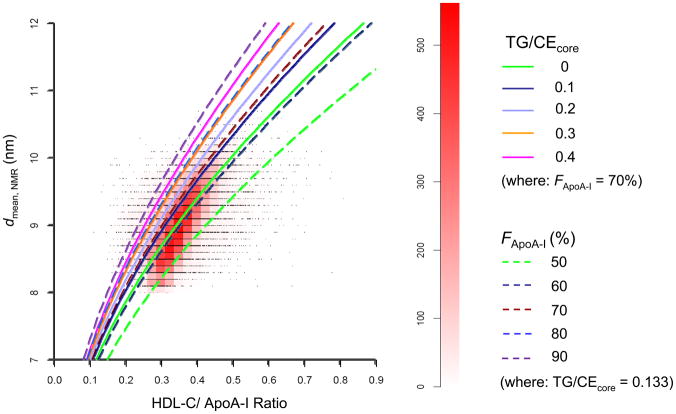
Fig. 2.
Superposition of the theoretical relationship (solid and dashed curves) between HDL diameter and HDL-C/ApoA-I ratio derived from the updated Shen model on the scatter plot/heat plot of the WHS data (Fig. 1). The theoretical curves also depend on the molar ratio of triglyceride-to-cholesterol ester in the hydrophobic core of the particles (TG/CEcore) and the fraction of ApoA-I in the HDL proteome (FApoA-I). See Supplemental Data for a derivation of the theoretical relationship based on the updated Shen model.

