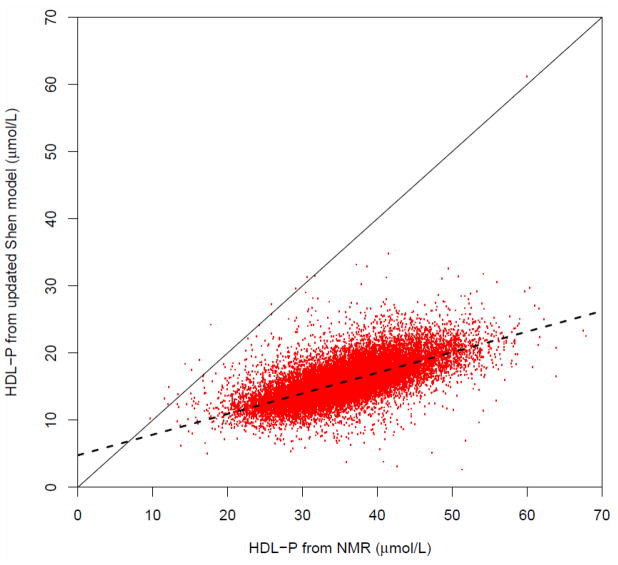
Fig. 3.
Correlation plot of the estimated HDL particle concentrations derived from the HDL-C/ApoA-I ratio and the ApoA-I concentration using the updated Shen model vs. the measured HDL particle concentrations obtained from NMR sprectroscopy in the WHS (n=26,772). Solid line corresponds to the line of identity. Dashed line corresponds to linear regression equation (Y = 4.77 + 0.307 X; r=0.676).

