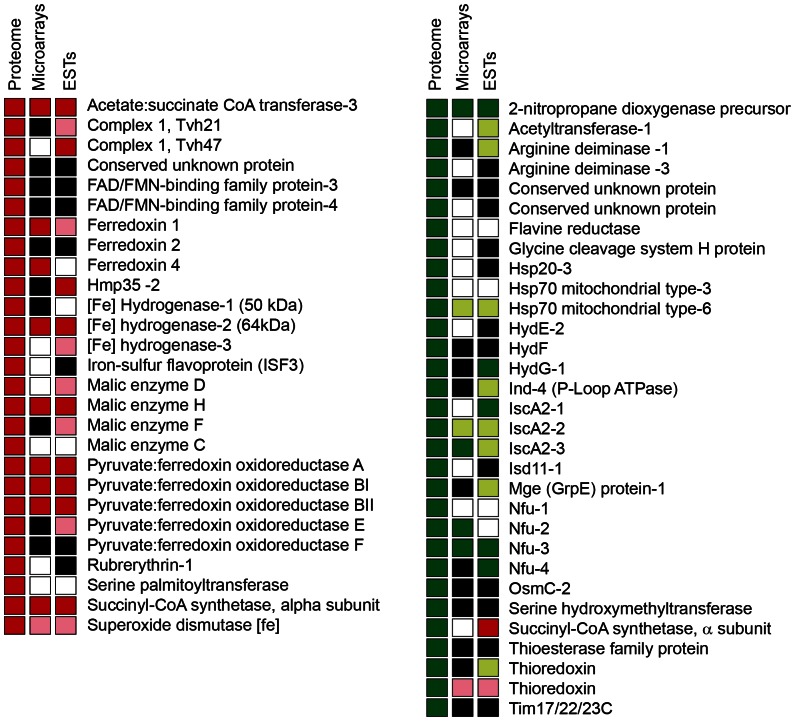
Figure 4. Comparison between iron-regulated proteins determined with the proteomic approach and the expression of corresponding genes studied by DNA microarrays and comparative EST analysis [18] .
Red square, significant upregulation under high iron; pink square, insignificant upregulation under high iron; green square; significant upregulation under low iron; light green square, insignificant upregulation under low iron; empty square, no change in the transcript level; black square, a gene that was not included in the analysis.

