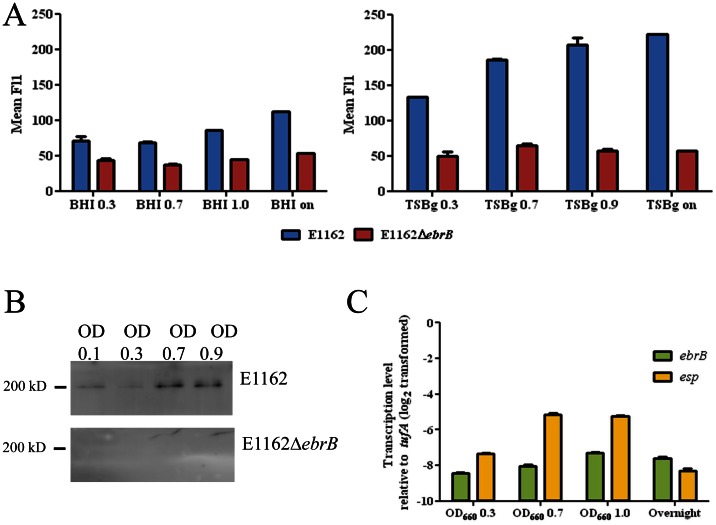
Figure 3. Dynamics of Esp expression.
(A) Cell surface Esp expression for wild-type strain (E1162) in blue and the ebrB mutant strain (E1162▵ebrB) in red, during growth in BHI and TSBg at OD660 0.3, 0.7 and 1.0 and from an overnight culture analyzed by flow cytometry using rabbit α-Esp immune serum. (B) Esp expression in E1162 and E1162▵ebrB cell extracts obtained during growth in TSBg at OD660 0.1, 0.3, 0.6 and 0.9 analyzed by Western blot using rabbit α-Esp immune serum. (C) qRT-PCR analysis of ebrB and esp expression ratios in E1162 at OD660 0.3, 0.7, 1.0 and overnight culture. The data from the qRT-PCR were normalized using tufA as an internal standard. The differences in gene expression (log2-transformed data) relative to tufA are shown.

