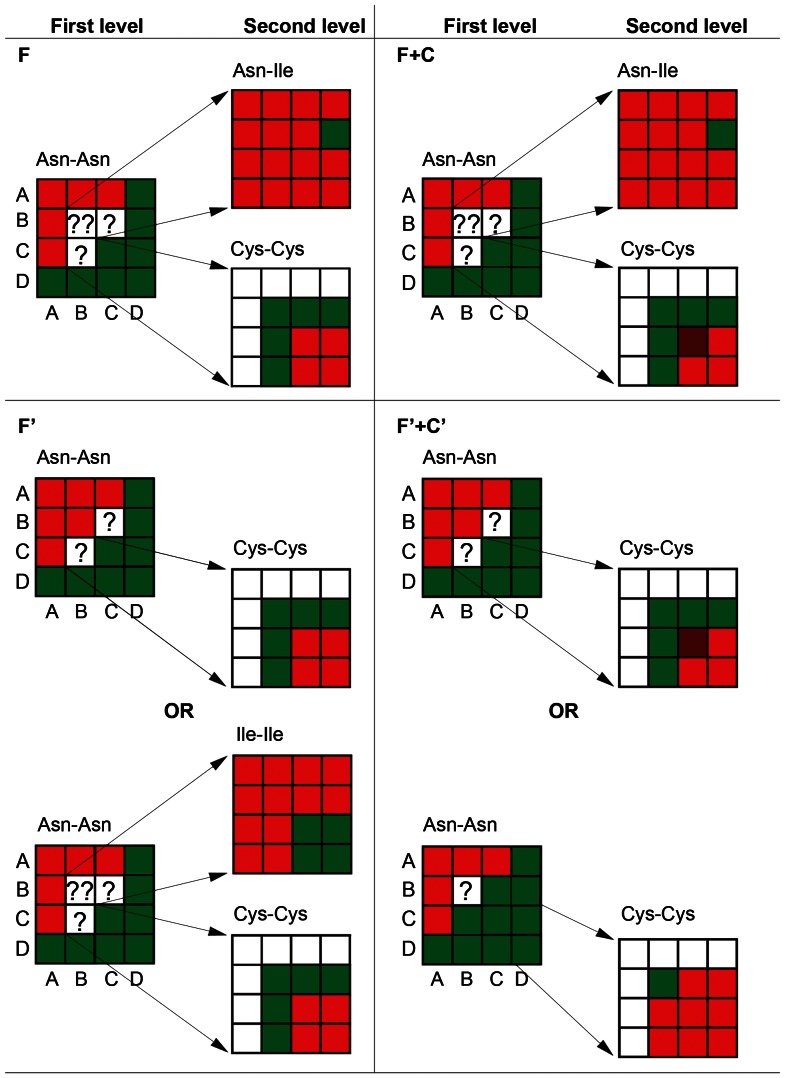
Figure 2. Synthesis of several decision trees generated during the ML training.
The aa at the top of each box is relative to the attributes specified at the first and second level of the trees. A, B, C and D indicate the low, moderate, high and very high bins, respectively (for more details, see Table 3 and the “Materials and Methods” section). Green boxes, a combination that classifies an instance as a PPI; Red boxes, a combination that classifies an instance as a no-PPI; Brown boxes, a combination that classifies an instance as a PPI or no-PPI; “?”, a combination for which an instance can not be classified, requiring classification at the next level of the tree.

