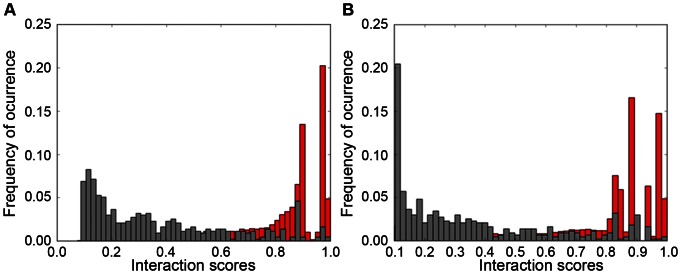
Figure 3. Graphics of classification of the test sets using the F and F′ Normal combined models.
The score represents the classification of the instances as PPI. The instances were classified as PPIs or no-PPIs, and no-PPIs classification scores were converted to interaction scores. “A”, classification of the F test set using the F Normal combined model; “B”, classification of the F′ test set using the F′ Normal combined model; Red, PPIs instances; Gray, no-PPIs instances.

