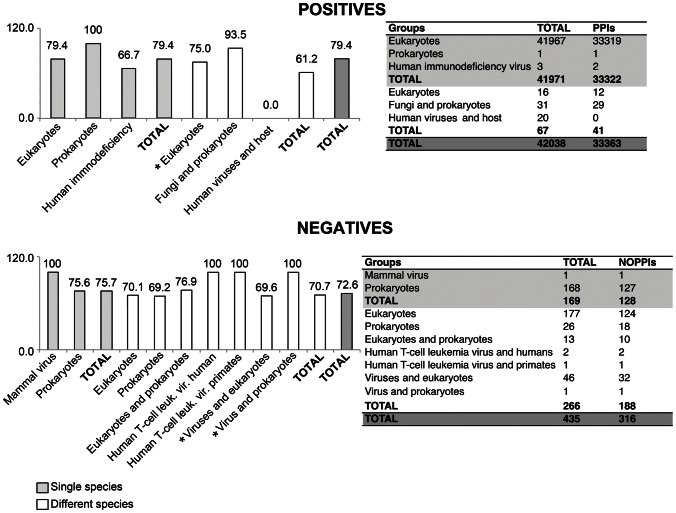
Figure 4. Detailed analysis of the classification of the test set using the F′ Normal combined model.
The values in the right side of each table and the score over each bar indicate the number and percentages of instances correctly classified, respectively. Single species, indicates PPIs and no-PPIs within the same species; Different species, indicates PPIs and no-PPIs among different species; *, groups that include instances of parasite-host associations.

