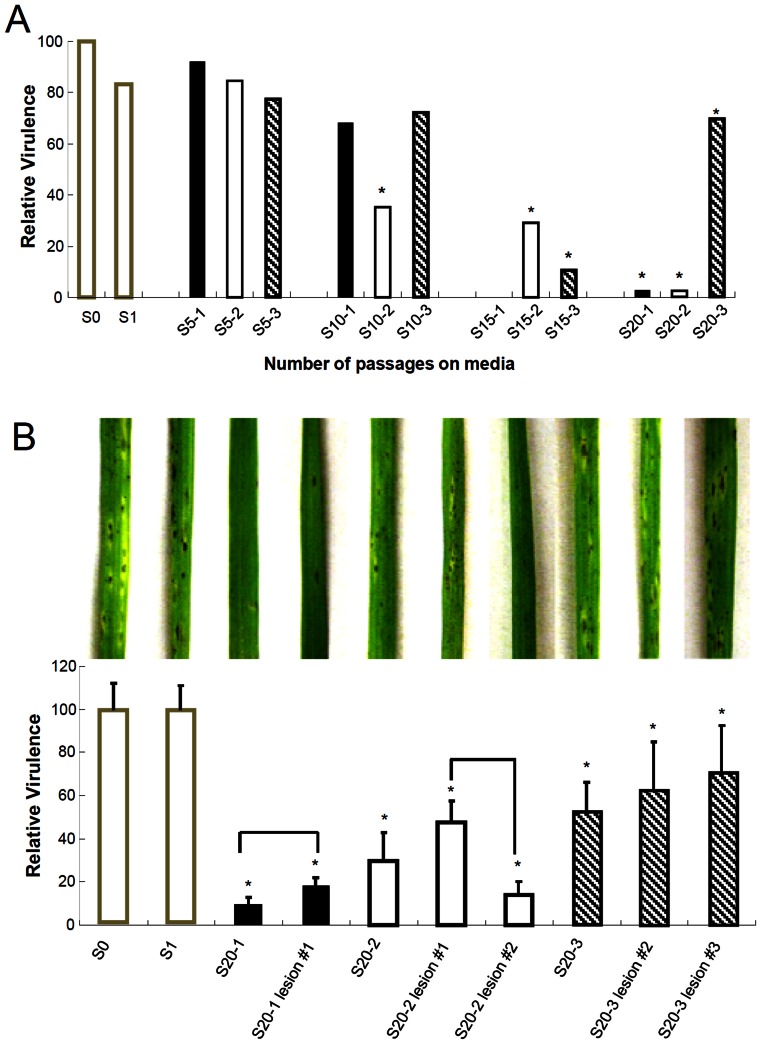
Figure 3. Virulence of the derived strains.
Relative virulence of the derived strains (A) and lesion isolates from the derived strains (B) to that of S0 is shown. Taking virulence of S0 as 100, the relative virulence of the derived strains and their lesion isolates were calculated and plotted. Asterisks indicate statistically significant difference between S0 and the derived strains and their lesion isolates (t test with P<0.05). Statistical difference within each group consisting of the derived strain and its lesion isolates was indicated by vertical brackets (Tukey test with P<0.05).

