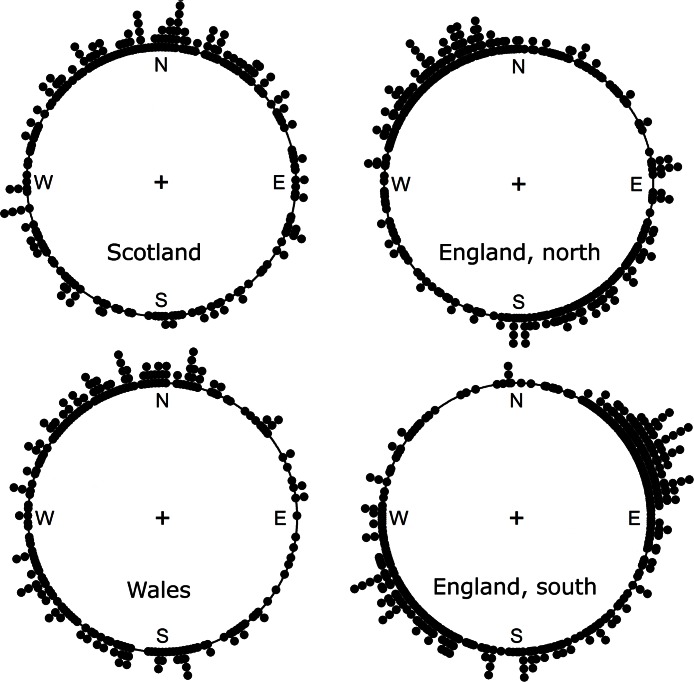
Figure 1. A circular histogram of the directions of movement of the centre of mass for those native species with increasing occupancy rates.
Each dot represents the direction of migration for one species. All distributions are significantly (p < 0.05) different from random using a Kuiper test. Directions of all species are available in Table S1.

