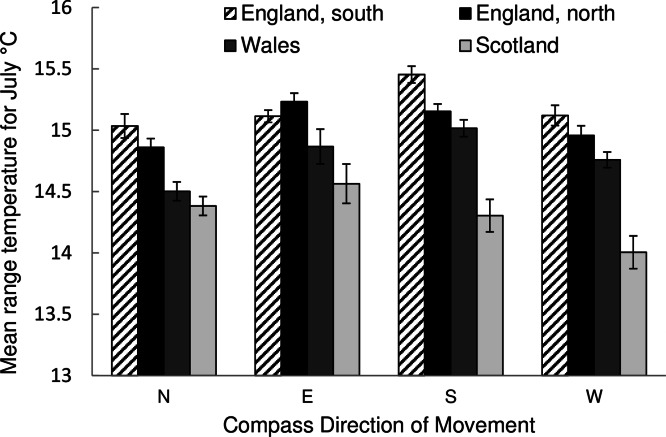
Figure 3. The mean July temperature of the ranges of species for the four different area partitions of the study.
Species which had increased occupancy over the period of this study are split by the direction of movement of their centre of mass, north, south, east or west. Error bars are two standard errors of the mean. The number of species contributing to each value are as follows, Scotland N-112 S-44 E-43 W-51, England, north N-117 S-82 E-61 W-71, Wales N-86 S-64 E-24 W-64, England, south N-48 S-98 E-174 W-103.

