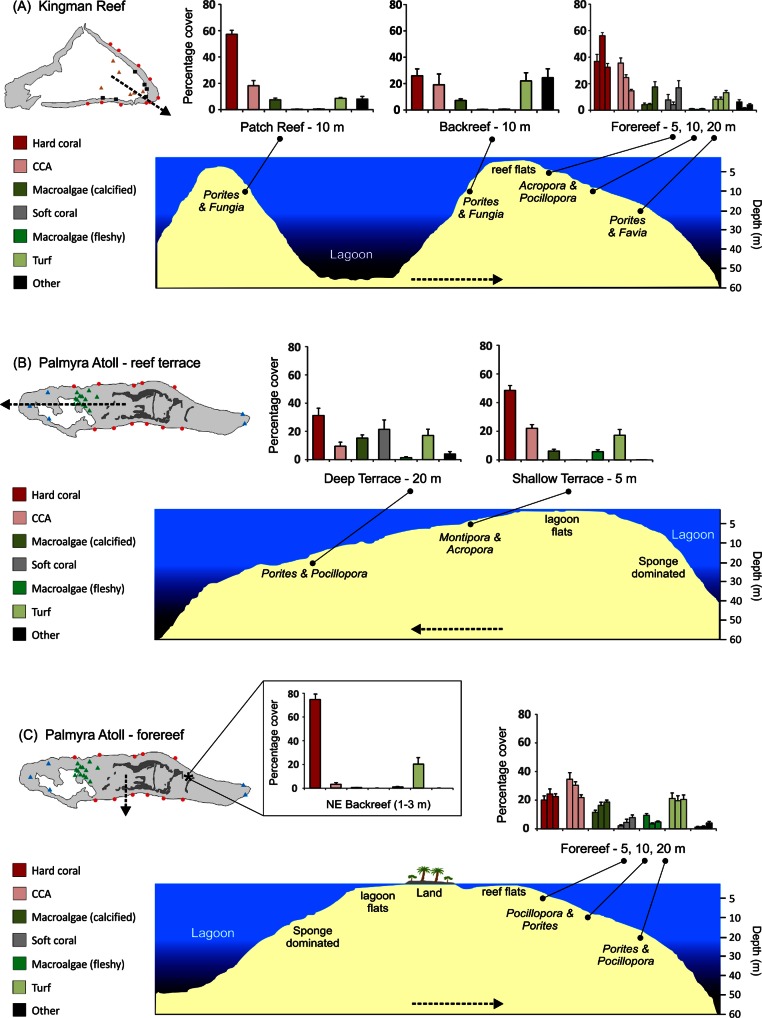
Figure 4. Stylized reef profiles from the two atolls.
Reef profiles for Kingman and Palmyra showing changes in percent cover of major benthic functional groups for: the transition from the lagoonal patch reef, across the backreef, and across forereef depths at Kingman (A), the transition from the shallow to the deeper reef terrace at Palmyra (B), and across forereef depths and the unique northeast backreef at Palmyra (C). Dominant hard coral genera (two most abundant in terms of percent cover in rank order) are indicated across habitats and depths in italics. Dashed lines indicate the position and direction of the cross-sectional profile.

