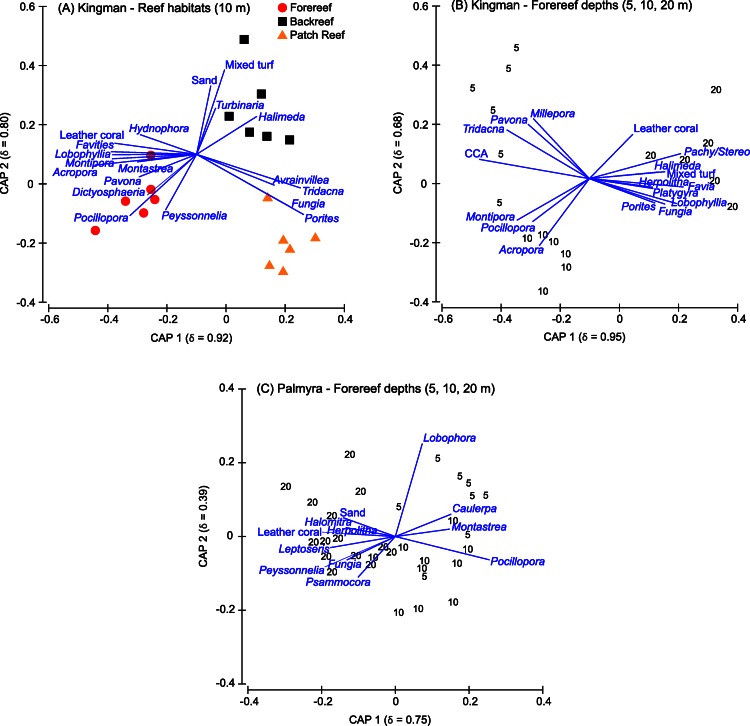
Figure 5. Canonical plots.
Canonical analysis of principal coordinates (CAP) based on a discriminant analysis, showing those benthic genera responsible for separation across reef habitats at Kingman (A) and across forereef depths on Kingman (B) and Palmyra (C). The squared canonical correlation value for the first two ordination axes is shown in parentheses in each case. Vector lines represent Spearman’s Rank correlations (threshold set at ≤0.4). The length of each vector line is proportional to the strength of the correlation. CCA, crustose coralline algae; Pachy/Stereo, Pachyclavularia/Stereonephthya.

