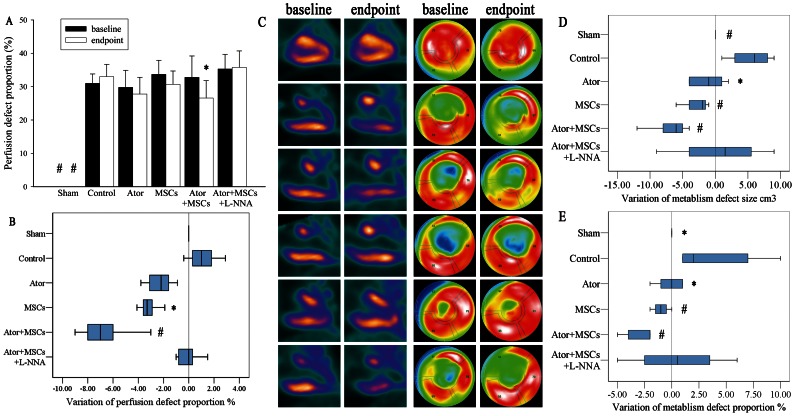
Figure 1. Myocardial perfusion and metabolism evaluated by 99mTc-MIBI SPECT and 18F-FDG PET-CT, respectively.
A. The perfusion defect proportion. B. The variation in perfusion defect proportion (variation = endpoint − baseline). C. The two left columns are the vertical long axis view of myocardial metabolism; the two right columns are the bull's eye polarmap. From top to below: Sham group, Control group, Ator group, MSCs group; Ator+MSCs group, Ator+MSCs+L-NNA group. D. The variation of metabolism defect size and proportion (variation = endpoint − baseline). Each group was compared with the Control group. * P<0.05, # P<0.01.

