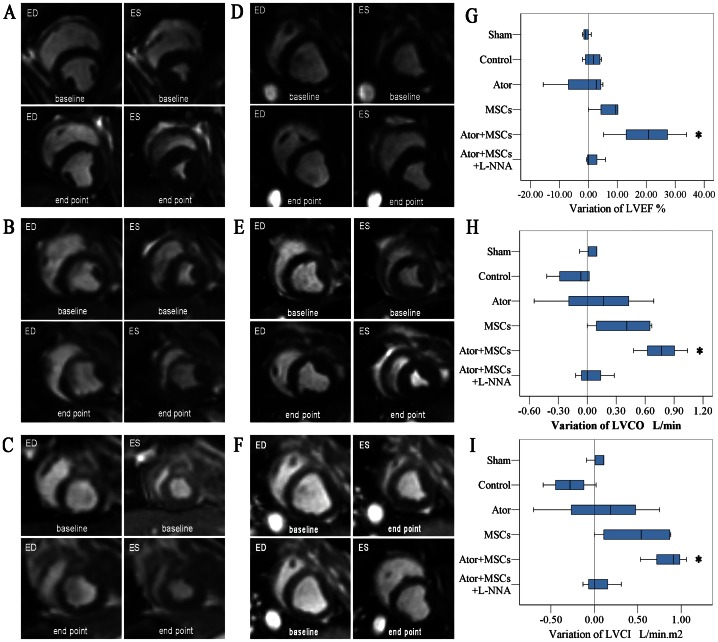
Figure 2. Left ventricular function evaluated using Cardiac MRI.
A–F: The short-axis image of the end-diastolic or end-systolic period. A. Sham group. B. Control group. C. Ator group. D. MSCs group. E. Ator+MSCs group. F. Ator+MSCs+L-NNA group. G–I: The variation of LVEF, LVCO, and LVCI (Variation = endpoint − baseline). Each group was compared with the Control group. * P<0.05, # P<0.01.

