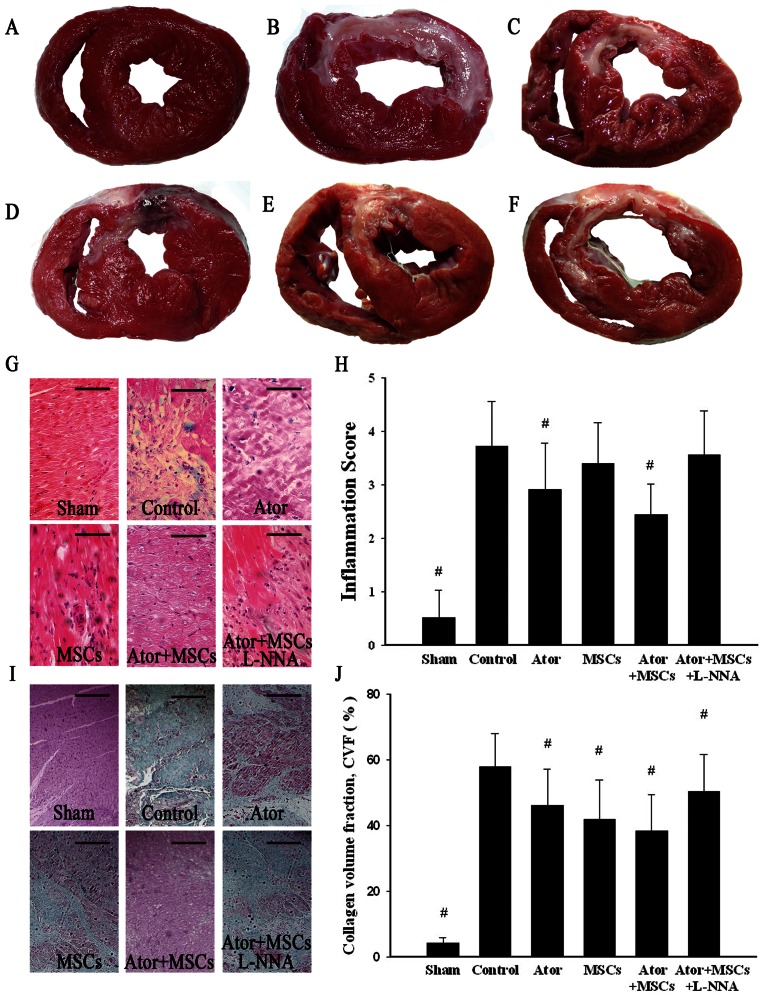
Figure 3. TTC staining and H&E/Masson's Trichrome staining.
A. Sham group. B. Control group. C. Ator group. D. MSCs group. E. Ator+MSCs group. F. Ator+MSCs+L-NNA group. Infarction tissue was stained as white and normal tissue was stained as red. G–H: H&E staining showed inflammatory cell infiltration and inflammation score. I–J: Masson's Trichrome staining and fibrosis. Each group compared with Control group. * P<0.05, # P<0.01. The magnification is 100×.Scale bar = 50 µm.

