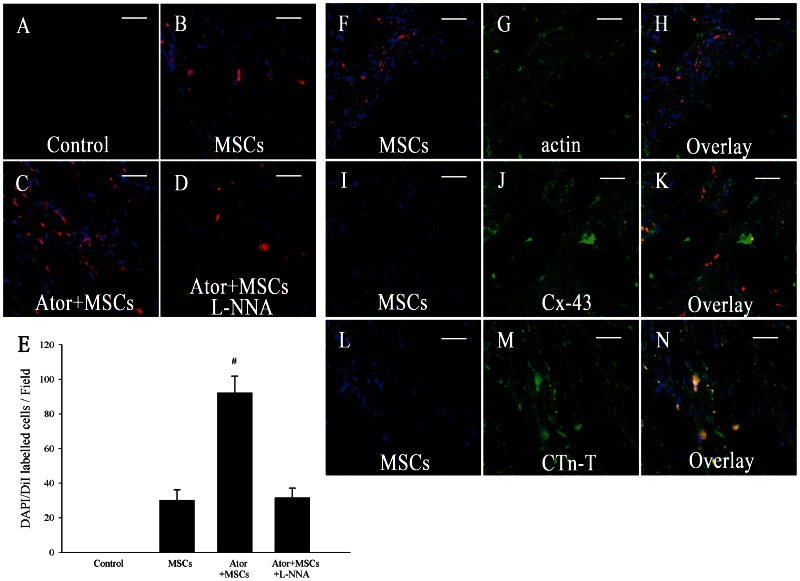
Figure 4. Survival and cardiomyogenesis potential of the implanted MSCs.
A–E: The survival of implanted MSCs in vivo. DAPI- (blue) and CM-DiI- (red) positive cells were counted using Image-Pro Plus 6.0 software. Double-labelled cells in each field were counted as surviving MSCs. The Ator+MSCs and Ator+MSCs+L-NNA groups were compared with the MSCs group. * P<0.05, # P<0.01. F–N: Cardiomyogenesis of the implanted MSCs in vivo(Ator+MSCs group). Cardiac-specific proteins are labeled with fluorescein isothiocyanate (green). The final magnification is 100×. Scale bar = 50 µm.

