
Figure 2. CD8+ T cell responses against conserved epitopes (bCSp) are associated with viral control.
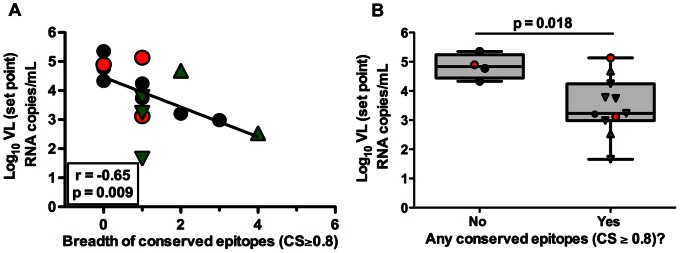
(A) The plasma VL set point was compared to breadth of conserved epitopes (Spearman Rank Correlation, r = −0.65, p = 0.009). The solid line represents a regression line. (B) The median plasma viral set point in individuals who mounted CD8+ T cell responses against at least one conserved epitope (Mann Whitney, p = 0.018). (A–B) Subjects possessing B*35Px, B*27 and B*57 alleles are represented by red circles, green triangles and inverted green triangles respectively.