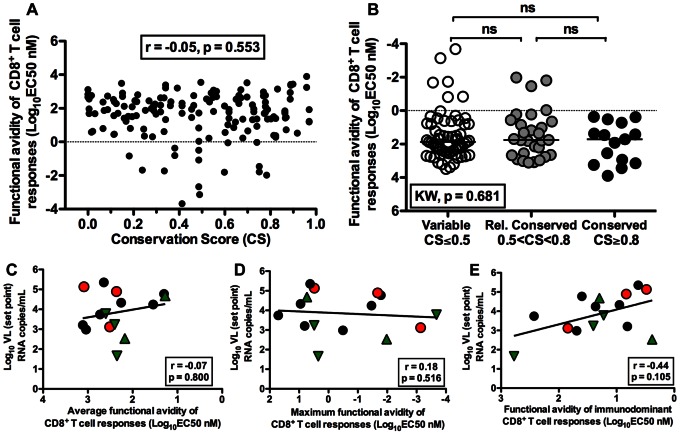
Figure 5. CD8+ T cell functional avidity and control of viral replication.
(A) Correlation between functional avidity and CS of CD8+ T cell epitopes. (B) The functional avidity of CD8+ T cells by CS (clade-B) grouping (Kruskal-Wallis, p = 0.681). Horizontal lines indicate median values. (C–E) Correlation between average (C), maximum (D) and immunodominant (E) functional avidity of CD8+ T cells in each subject with average plasma viral set point (Spearman Rank Correlation, r = −0.07, p = 0.800; r = −0.18, p = 0.516 and r = −0.44, p = 0.105 respectively). (C–E) The solid line represents a regression line. Subject possessing B*35Px, B*27 and B*57 allele are represented by red circles, green triangles and inverted green triangles respectively.

