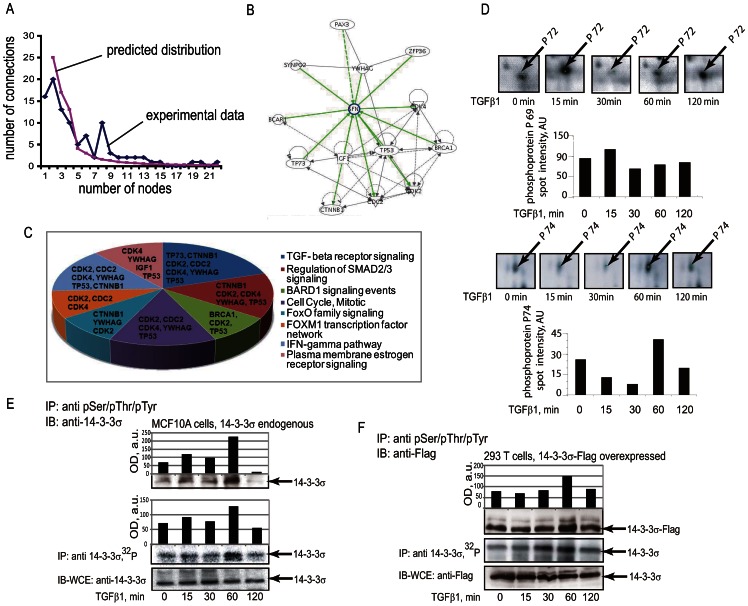
Figure 2. 14-3-3σ sub-network of TGFβ1-regulated phosphoproteins.
(A) Graphs show distribution of connections for species of the network. Distribution for proteins identified by phosphoproteomics (rhombs; experimental data) and as would be expected by a power law distribution of connections of species in an ideal scale-free network (squares; predicted distribution) are shown. (B) A sub-network of 14-3-3σ (SFN). Proteins which are in proximal dependencies to 14-3-3σ were extracted from the complete network (Figure S5) into the presented sub-network. (C) Signaling pathways involving the proteins assembled in the 14-3-3σ sub-network. The analysis was performed using Gene Set Analysis Toolkit V2 software. (D) Validation of 14-3-3σ phosphorylation upon treatment of cells with TGFβ1. Images of the areas of 2D Fe-IMAC gels with annotation of phosphoprotein spots p72 and p74, in which 14-3-3σ was identified are shown. Values of the protein spot volumes are shown below images of gels for both protein spots. (E) Phosphorylation of endogenous 14-3-3σ in MCF10A cells was evaluated by immunoprecipitation with anti-phosphoserine, threonine and tyrosine antibodies (upper panel) or by incorporation of 32P (middle panel). Control immunoprecipitation of 14-3-3σ is shown in lower panel. Densitometry analysis of the protein immunoblots or 32P incorporation is shown in accompanying graphs. (F) Phosphorylation of Flag-14-3-3σ fusion protein expressed in HEK293T cells was evaluated in the same way as for endogenous protein. The upper panel shows detection of phosphorylation by immunoprecipitation and the middle panel shows incorporation of 32P. The lower panel shows expression of 14-3-3σ. Migration positions of 14-3-3σ are shown by the arrows and treatments with TGFβ1 are indicated. Densitometry analysis of the protein immunoblots is shown in accompanying graphs. Representative experiments out of 3 performed are shown.

