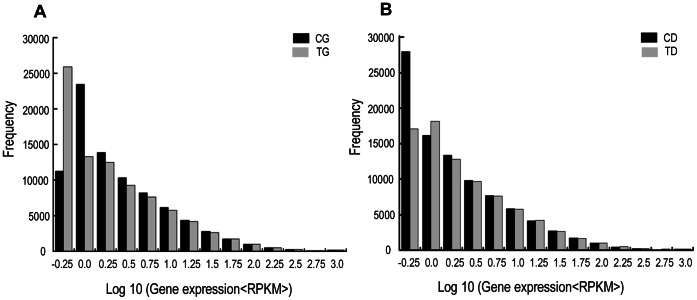
Figure 4. The level of gene expression for each gene.
Gene expression level was determined by calculating the number of reads for each gene and then normalized to RPKM (Reads per kilobase per Million). A indicates the distribution of genes in CG and TG, B indicates the distribution of genes in CD and TD.

