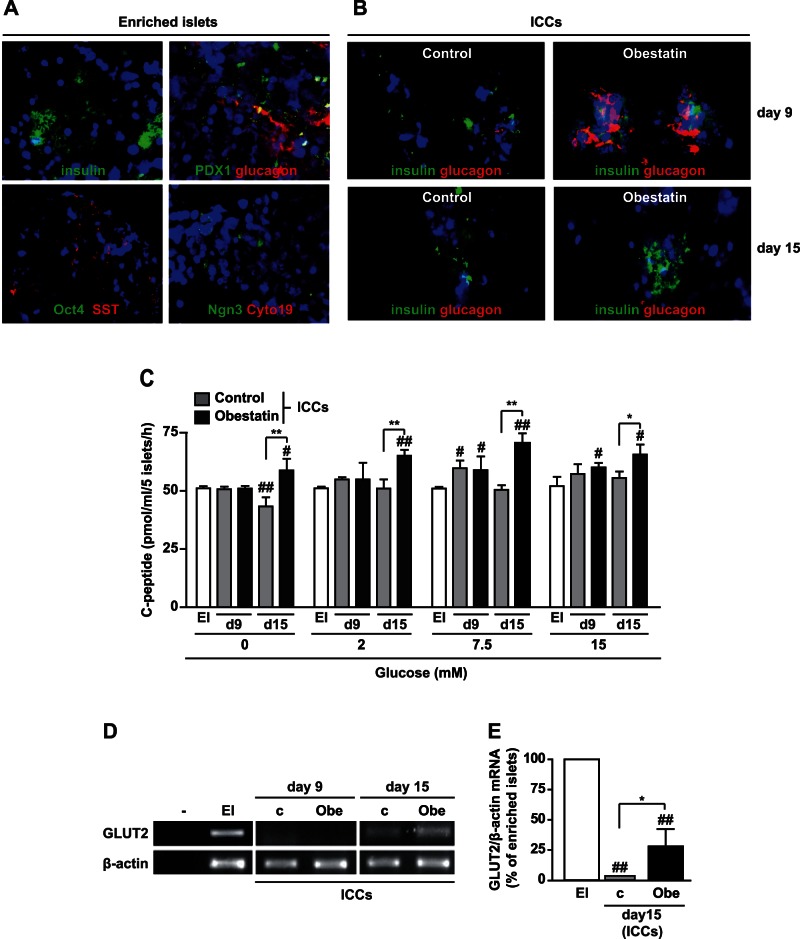
Figure 3. Differentiation markers and hormone expression in islets and ICCs and obestatin effects on C-peptide secretion.
(A) Fluorescence microscopy images showing enriched islets stained for insulin, glucagon and somatostatin and the indicated markers of progenitors (magnification, X20). Cytokeratin 19 (Cyto19) was used as marker for pancreatic ducts. (B) Immunofluorescent staining for insulin and glucagon in ICCs formed in either absence (control) or presence of obestatin at the indicated days (magnification, X40). (C) C-peptide secretion, assessed by ELISA, from ICCs stimulated at either day 9 or day 15 with the indicated concentrations of glucose. Results are the mean ± SEM of three different experiments performed in duplicate (*P<0.05, **P<0.01 vs. control ICCs; # P<0.05 ## P<0.01 vs. enriched islets, EI). (D) GLUT-2 mRNA determined by RT-PCR. β-actin was used as housekeeping gene. Shown is a representative image of three independent experiments. Buffer alone was used as negative control (–) (c, control, no obestatin). (E) Densitometric analysis of GLUT-2 mRNA normalized to β-actin and reported as percent of enriched islets (EI) (*P<0.05 vs. control ICCs; ## P<0.01 vs. EI).

