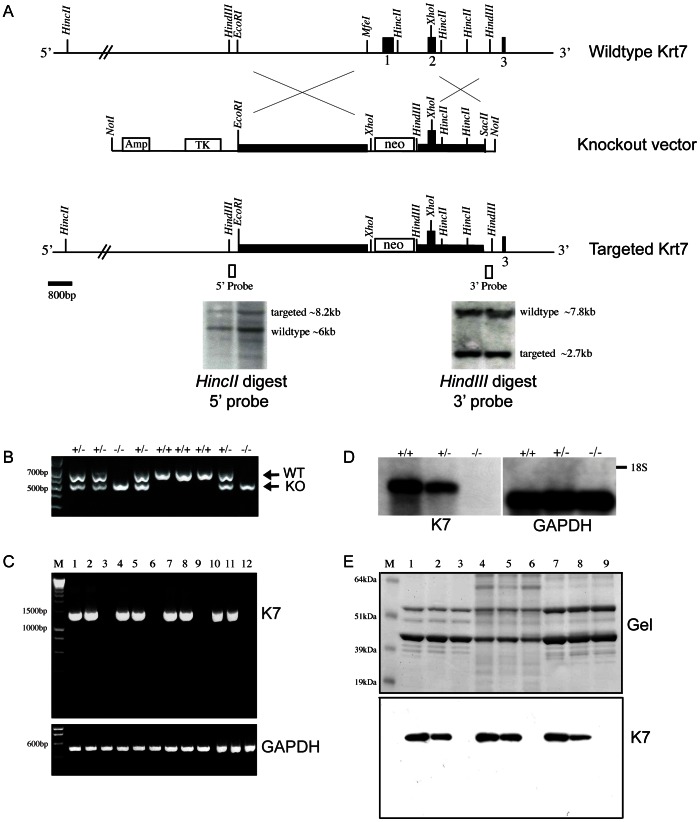
Figure 1. Krt7 gene targeting strategy.
A. Schematic diagram of the mouse Krt7 gene and upstream sequences, only the proximal part of the gene encompassing exons 1 to 3 is shown. Filled black boxes denote exons 1, 2, 3. The long and short homology arms of the targeting vector are indicated by filled black rectangles. Restriction enzyme sites are as indicated and the open black boxes denote the locations of the DNA probes that were used for southern blotting at the 5′ and 3′ ends of recombination in targeted ES cells. B. Genotyping of K7 knockout mice, the wildtype allele is 743 bp, the targeted allele is 593 bp. C. RT-PCR analysis of cDNA from the bladder (lanes 1–3), lung (lanes 4–6), colon (lanes 7–9) and kidney (lanes 10–12) amplified with primers to full-length K7 (∼1.5 kb) and GAPDH (509 bp). Lanes 1, 4, 7 and 10 are from wildtype mice; lanes 2, 4, 6 and 8 are from heterozygote K7 knockout mice; lanes 3, 6, 9 and 12 are from homozygous K7 knockout mice. M = DNA size standards. D. Northern blot of bladder RNA from wildtype (+/+), heterozygous (+/−) and homozygous (–) mice detected with RNA probes to K7 and GAPDH. The position of the 18S ribosomal subunit is indicated by a black bar. E. Coomassie blue SDS-PAGE gel and western blot of cytoskeletal extracts prepared from the bladder (lanes 1, 2, 3), lung (lanes 4, 5, 6) and colon (lanes 7, 8, 9) of wildtype (lanes 1, 4, 7), heterozygous (lanes 2, 4, 6) and homozygous (lanes 3, 6, 9) K7 knockout mice probed with a C-terminal K7 antibody. M = molecular weight standards, sizes in kDa are as indicated.

