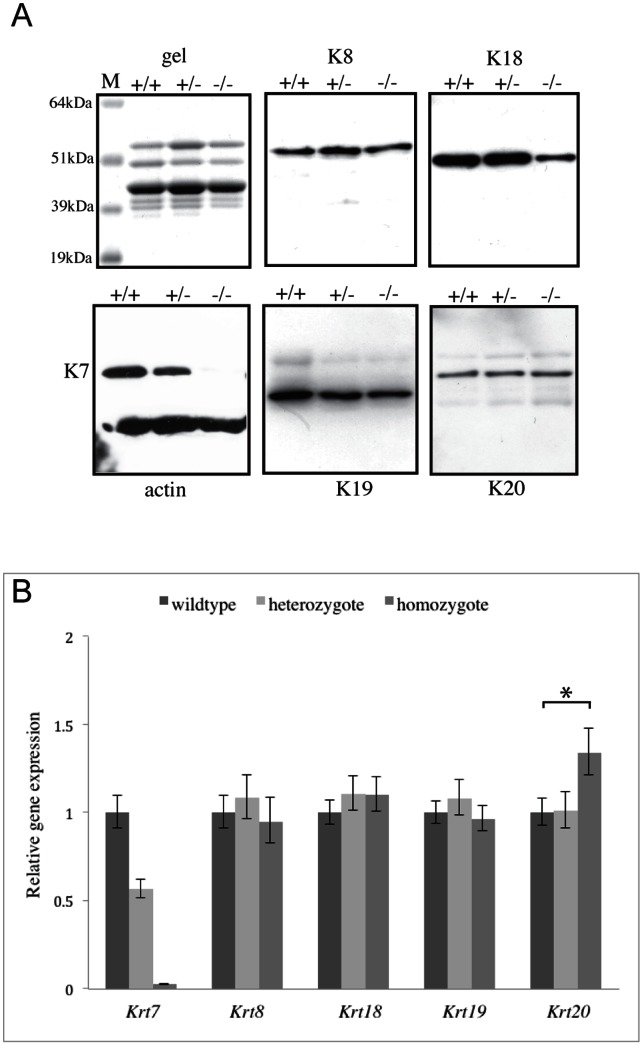
Figure 5. Simple keratin expression in the bladder of K7 knockout mice.
A. Coomassie blue stained SDS-PAGE gel and western blots of cytoskeletal-enriched extracts prepared from the bladder, lung and colon of wildtype (+/+), heterozygous (+/−) and homozygous (–) K7 knockout mice probed with antibodies to K8, K18, K19 and K20. A monoclonal antibody to β-actin was used to monitor protein loading and was co-incubated with the polyclonal K7 antibody on the same blot. M denotes molecular weight standards, sizes in kDa are as indicated. B. Quantitative RT-PCR of bladder cDNA from wildtype, heterozygous and homozygous K7 knockout mice (five bladders per genotype) analysed with Taqman® gene expression probes to Krt7, Krt8, Krt18, Krt19 and Krt20. GAPDH was used as the endogenous control to allow for normalisation between individual samples. Three experimental replicates were performed for each cDNA sample and the results for each of the five biological replicates per genotype were combined to determine the level of gene expression. The expression level of each gene in heterozygous and homozygous samples is shown relative to the expression of the wildtype sample. The error bars indicate the maximum (RQmax) and minimum (RQmin) expression levels for each gene as determined by the RQ Manager 1.2.1 software (using 99% confidence limits). * indicates a p value of 0.04.

