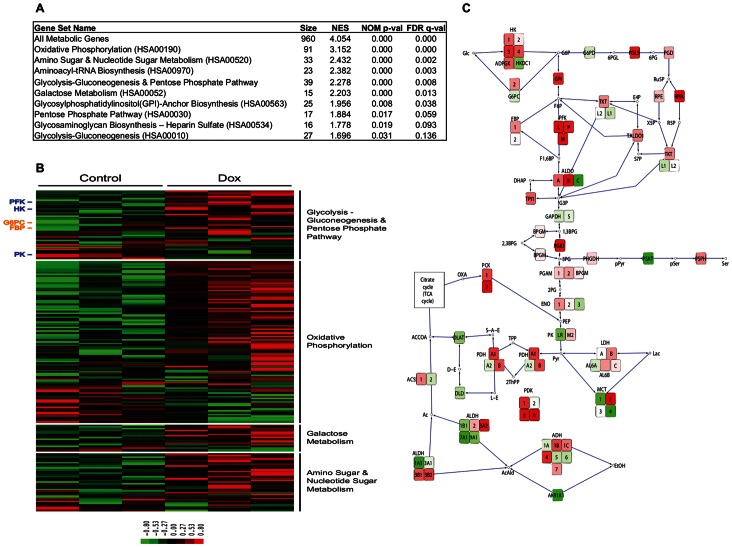
Figure 1. Doxycycline alters the metabolic gene expression profile of MCF12A cells.
Treatment of MCF12A cells with Dox at a concentration of 1 µg/mL shows widespread changes in expression of metabolic genes. A) GSEA reveals the most significantly altered metabolic pathways, ranked by normalized enrichment score (NES), in Dox treatment compared to vehicle. KEGG pathway entries are denoted in parentheses where appropriate. Pathways without KEGG entries–All Metabolic Genes and Glycolysis-Gluconeogenesis & Pentose Phosphate–are artificial combinations of other pathways with redundant genes collapsed. All Metabolic Pathways includes all non-redundant genes from every KEGG pathway analyzed. B) This heat map highlights changes in the constituent genes of the oxidative phosphorylation and glycolysis/gluconeogenesis/pentose phosphate pathways upon treatment. Annotated genes include those encoding regulatory enzymes in glycolysis (phosphofructokinase (PFK), hexokinase (HK), pyruvate kinase (PK), shown in blue) and in gluconeogenesis (glucose-6-phosphatase (G6PC) and fructose-1,6-bisphosphatase (FBP), shown in orange). (C) Altered expression of regulatory enzymes in glycolysis and its proximal carbon shunts are shown schematically, with red indicating upregulation and green indicating downregulation.

