
Figure 2. Cd-induced intracellular [Ca2+]i elevation in cerebral cortical neurons.
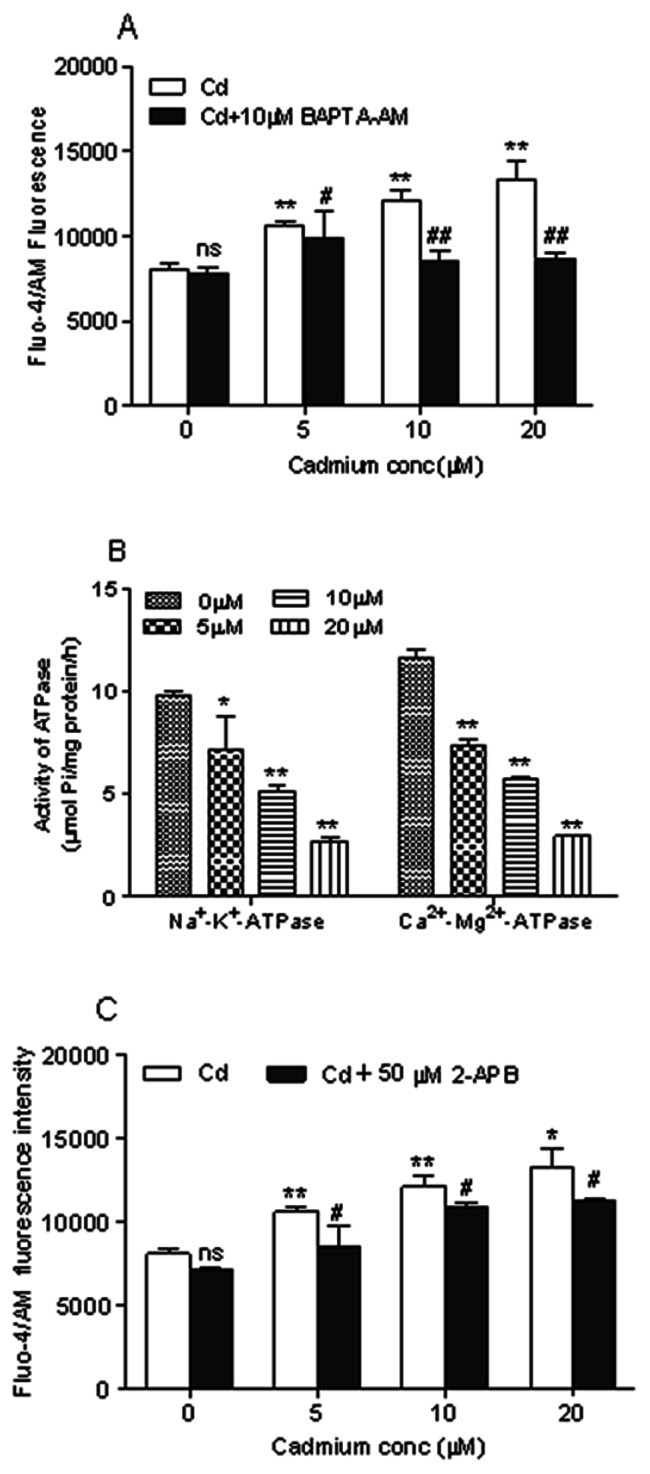
(A) Cd-induced elevation of [Ca2+]i was diminished by BAPTA-AM. Cells were pretreated with 10 µM BAPTA-AM for 30 min, followed by treatment with Cd for another 12 h and incubated with 5 µM Fluo-4 AM dye for a total of 30 min before analysis by flow cytometry. Results were expressed as mean fluorescence. Each bar represents mean ± SD (n = 6). *Statistical significance between control and Cd treatment (5, 10 and 20 µM); #Statistical significance between cells cultured in the absence and presence of BAPTA-AM. ns Not significant; **P<0.01; # P<0.05, ## P<0.01, using Student’s t-test. (B) Inhibition of Na+/K+-ATPase and Ca2+/Mg2+-ATPase activities by Cd in cerebral cortical neurons. The neurons were treated with Cd (0,5, 10 and 20 µM) for 12 h to measure the assays. Data are mean ± SD of three experiments from cells of different cultures, each one performed in triplicate. *P<0.05, **P<0.01 compared to control, using Student’s t-test. (C) Calcium released from ER through IP3R channels is a major cause of Cd-induced elevation of [Ca2+]i. Cells were pretreated with 50 µM 2-APB for 30 min, followed by treatment with Cd for another 12 h. The cytosolic calcium level was analyzed by Fluo-4 AM staining and flow cytometry. Results are expressed as mean fluorescence. Each bar represents mean ± SD (n = 6). *Statistical significance between control and Cd treatment (5, 10 and 20 µM); #Statistical significance between cells cultured in the absence and presence of 2-APB. ns Not significant; *P<0.05, **P<0.01; # P<0.05, using Student’s t-test.