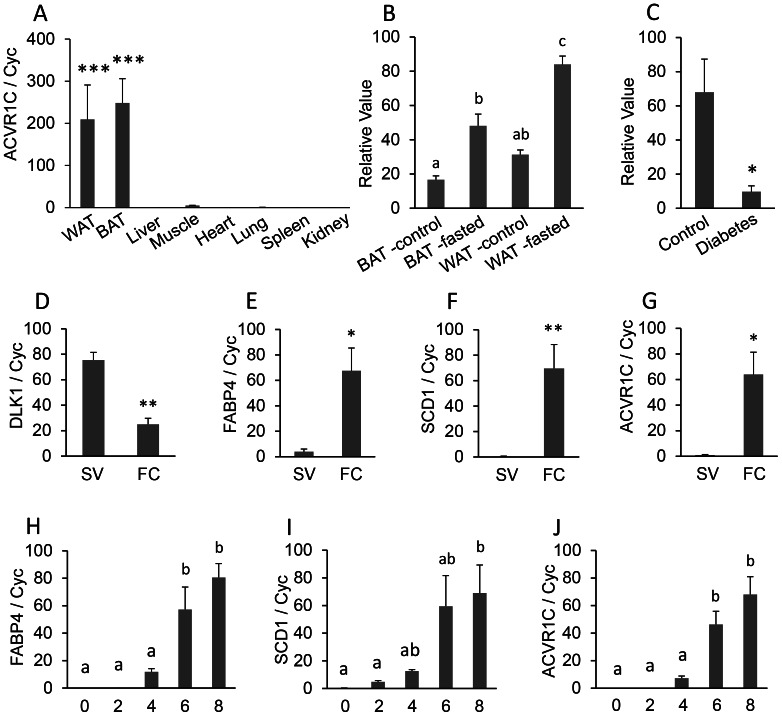
Figure 5. ACVR1C (activin A receptor, type IC) mRNA expression.
A, Real-time PCR for ACVR1C mRNA tissue distribution. Total RNA were isolated from the white adipose tissue (WAT), brown adipose tissue (BAT), liver, muscle, heart, lung, spleen, and kidney of adult mice. The mRNA expression was measured by quantitative real-time reverse transcription PCR (qRT-PCR) (n = 3). The bar represents mean ± SEM. Statistical significance is indicated by ***(P<0.001). Housekeeping gene cyclophilin (cyc) was used to normalize the mRNA expression. B and C, Analysis of microarray DataSets obtained from the NCBI website containing expression profiles for ACVR1C. B: GDS3135 (n = 4 per group) and C: GDS3665 (n = 5 per group). D–G, Relative expression of DLK1, FABP4, SCD1, and ACVR1C in the stromal-vascular (SV) and fat cell (FC) fractions from mouse inguinal adipose tissue. Each bar indicates mean and SEM (n = 5). Statistical significance by Student’s t test is shown: *, P<0.05; **, P<0.01. The gene expression was normalized to cyclophilin (cyc) mRNA expression. H–J, Developmental regulation of ACVR1C during adipogenic differentiation of 3T3-L1 cells. The bar represents mean ± SEM (n = 3). Letters a and b show significant differences in gene expression among several time-points (day 0, 2, 4, 6, and 8) in adipocyte differentiation at P<0.05. The mRNA abundance was measured by quantitative real-time reverse transcription PCR (qRT-PCR) and normalized to cyclophilin (cyc) mRNA.

