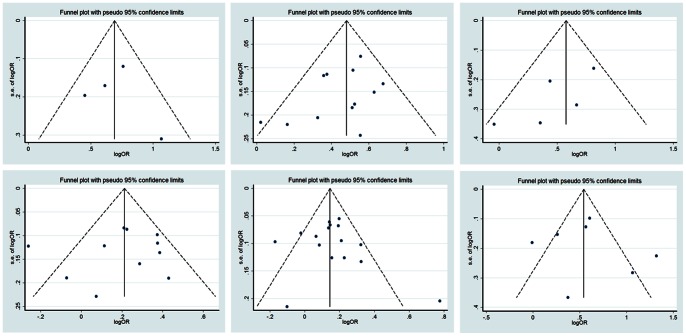
Figure 5. Funnel plot of publication bias test for ABT and HCC clinical outcomes.
Postoperative death at 3 year (upper left), postoperative death at 5 year (upper middle), postoperative recurrence at 1 year (upper right), postoperative recurrence at 3 year (lower left), postoperative recurrence at 5 year (lower middle), postoperative complications (lower right). Horizontal axis represents the log of OR; vertical axis represents SE of log(OR). CI, confidence interval; OR, odds ratio; Log, logarithm; SE, standard error.

