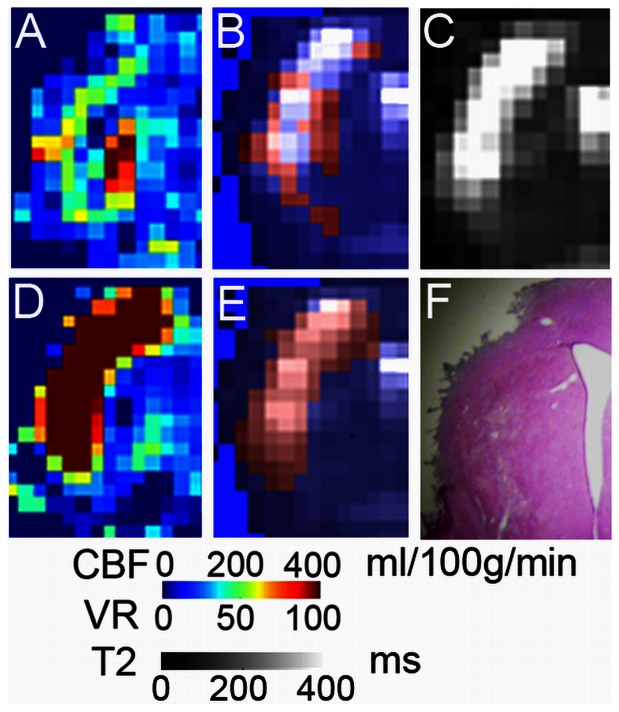
Figure 5. Distribution of voxels with increased d14 vasoreactivity.
(A) Infarct region of one animal on d14 - CBF map with hyperperfused voxels (B, shown in red) overlaid onto the d14 - T2 map (B and C). These voxels were localized to the infarct border. (D) Day 14 – vasoreactivity (VR) map. Voxels with increased vasoreactivity are shown in red and overlaid on the T2 map: E. Hematoxylin-eosin stained section of the corresponding region in F.

